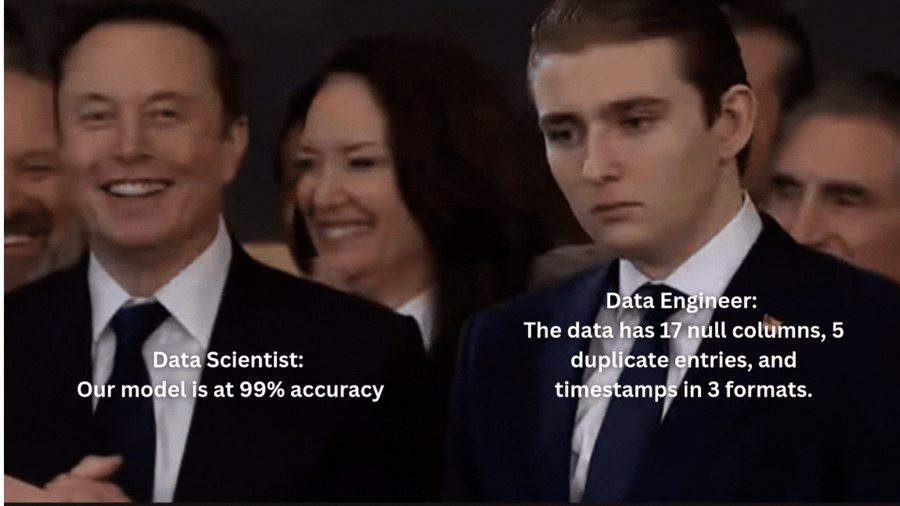
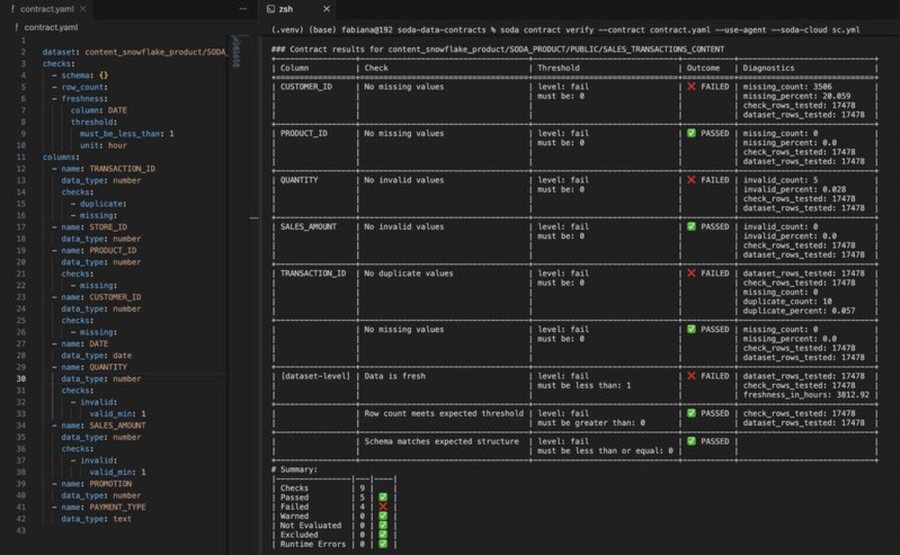
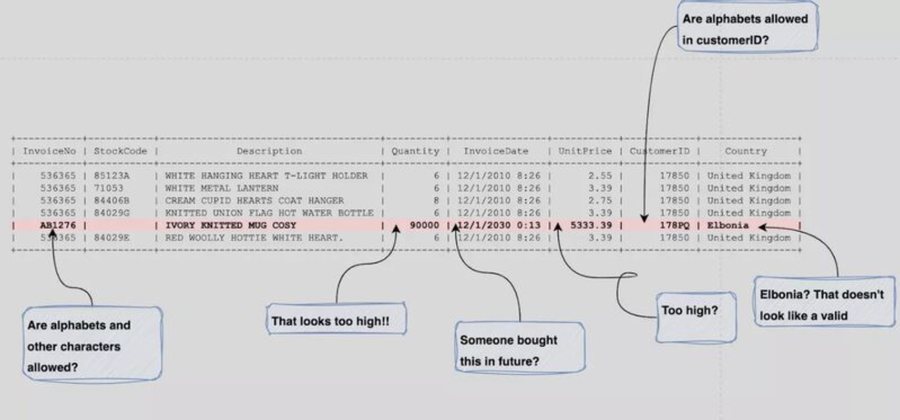
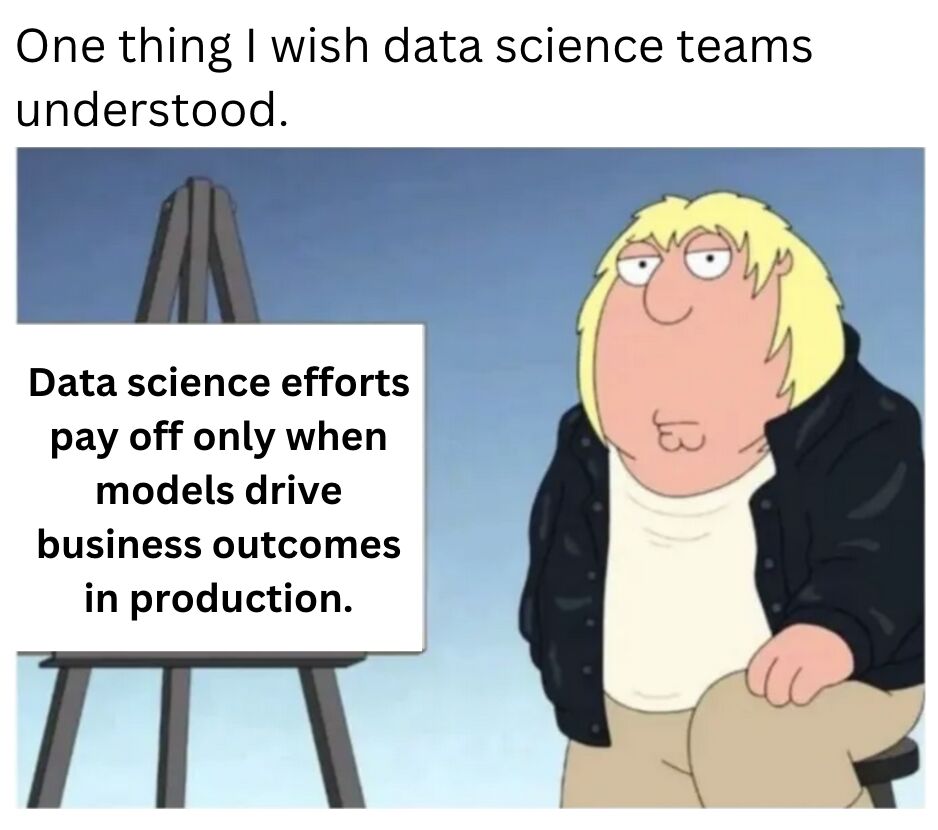
Bad data quality ruins everything.
Models might perform well in the lab, but the reality of inconsistent, incomplete, or messy data in production can bring entire systems to a halt.
For Data Engineers, it’s a constant battle to stay on top of these issues.
Catching and fixing problems early doesn’t just save time,
it makes sure the work being done downstream actually holds up.
Because no matter how good the science is, if the data is bad, nothing works.
--
Inspo from Maria Vechtomova
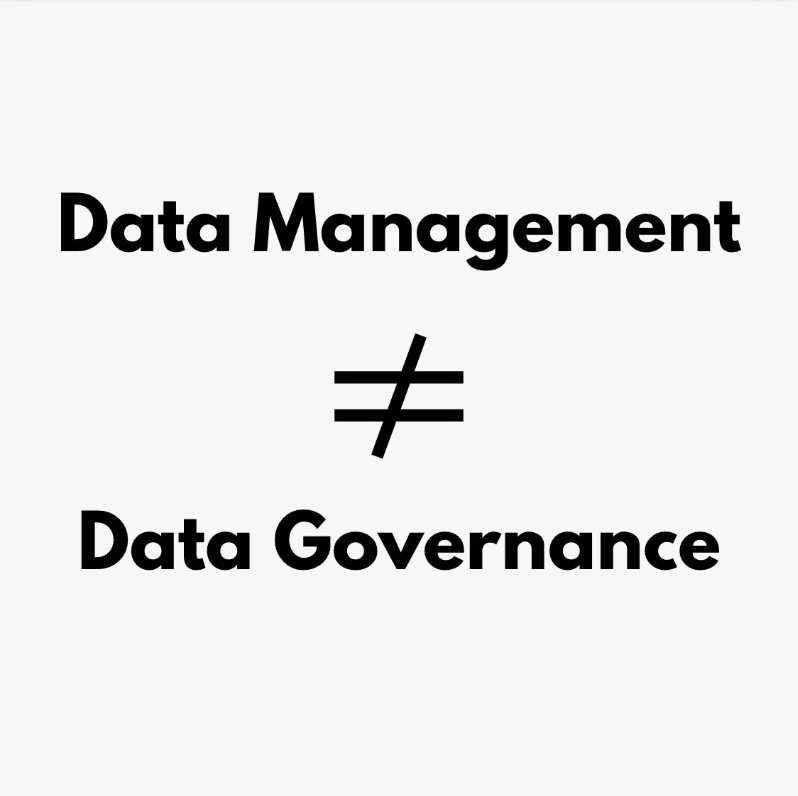
Are data governance and data management the same thing?
They’re tightly connected, but they’re not interchangeable.
Here’s how I break it down:
➨ Data governance is about setting the rules.
It defines who owns what data, what quality standards apply, how access is controlled. Overall its a framework of policies, roles, and decision rights that help data serve business goals safely and reliably.
➨ Data management is about putting those rules into practice.
It revolves the day-to-day operations like ingesting, transforming, storing, cataloging, securing, and maintaining data.
In short, governance defines the what and why. Management handles the how.
Both matter. But treating them as the same thing often leads to vague policies that never get implemented.
How do you draw the line between governance and management in your org?
We try to make the job of Data Governance easier at Soda. Learn how: https://lnkd.in/e4FNM-xa
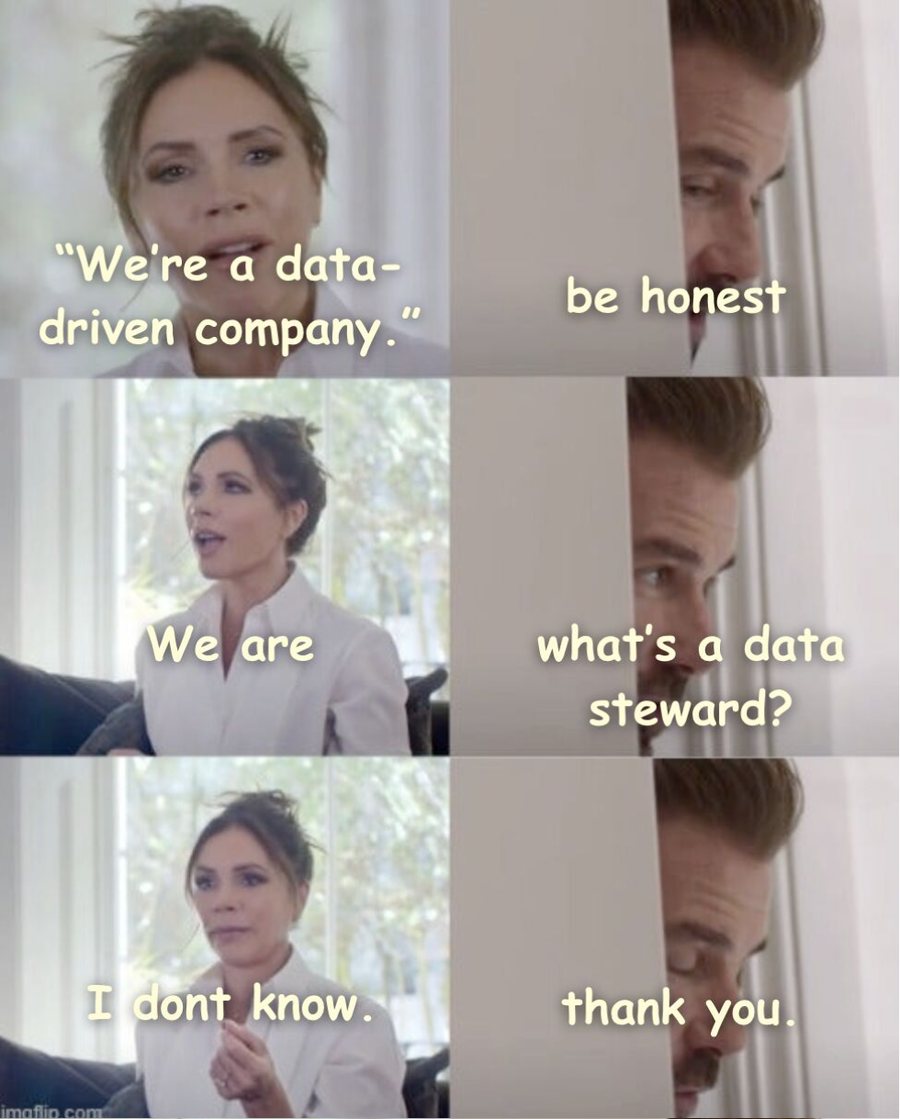
Most companies in 2026 say they want to be data-driven, but most won’t understand what data stewardship means.
A data steward helps teams understand the structure, meaning, and reliability of data.
They
• clarify which metrics matter, and why.
• define key terms so everyone uses the same vocabulary.
• explain where data comes from and how it’s transformed.
• support people in asking better questions, not just using more dashboards.
Not every company has a formal data steward role.
But someone on your team has probably been doing this work already.
They answer metric questions, document definitions, and resolve confusion between teams.
Thank them.
They’re doing foundational work for your data culture.
Soda helps data stewards by closing the loop on Data Quality.
AI-powered resolution of broken records with Stewards in the loop.
So that they can do more of what they love: https://lnkd.in/emh5J-gH
Let us go back to the basics of data governance for a moment.
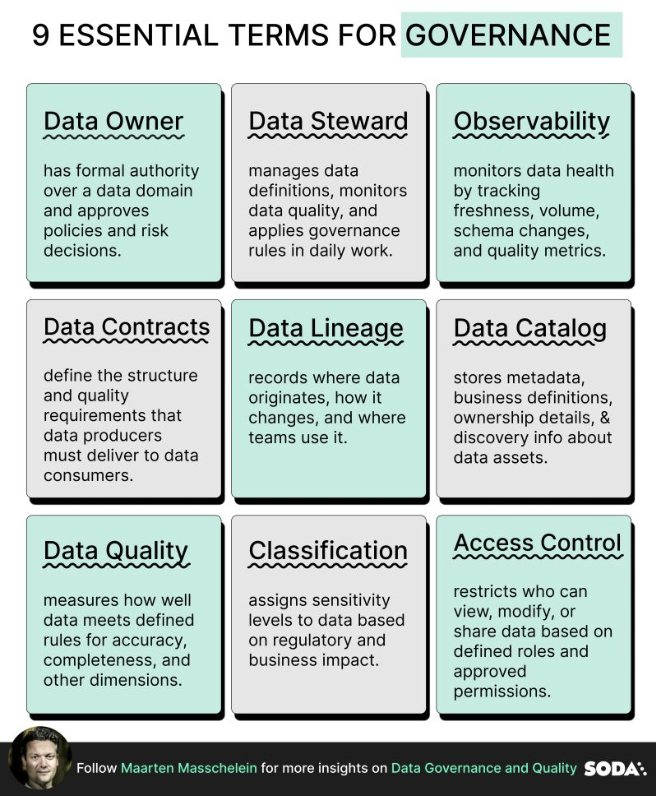
Here are 9 foundational terms every data governance leader should align on:
👤 Data Owner: A data owner has formal authority over a data domain and approves policies and risk decisions.
🛠️ Data Steward: A data steward manages data definitions, monitors data quality, and applies governance rules in daily operations.
🔎 Data Observability Data observability monitors data health by tracking freshness, volume, schema changes, and quality metrics.
📜 Data Contracts Data contracts define the structure, schema, and quality requirements that data producers must deliver to data consumers.
🔁 Data Lineage: Data lineage records where data originates, how it changes, and where teams use it.
📚 Data Catalog : A data catalog stores metadata, business definitions, ownership details, and discovery information about data assets.
🧾 Data Classification: Data classification assigns sensitivity levels to data based on regulatory and business impact.
🎯 Data Quality Data quality measures how well data meets defined rules for accuracy, completeness, consistency, validity, uniqueness, and timeliness.
🔐 Data Access Control Data access control restricts who can view, modify, or share data based on defined roles and approved permissions.
If teams do not align on definitions, governance becomes a procedural activity without measurable control.
Clear terminology is the starting point for accountable execution.
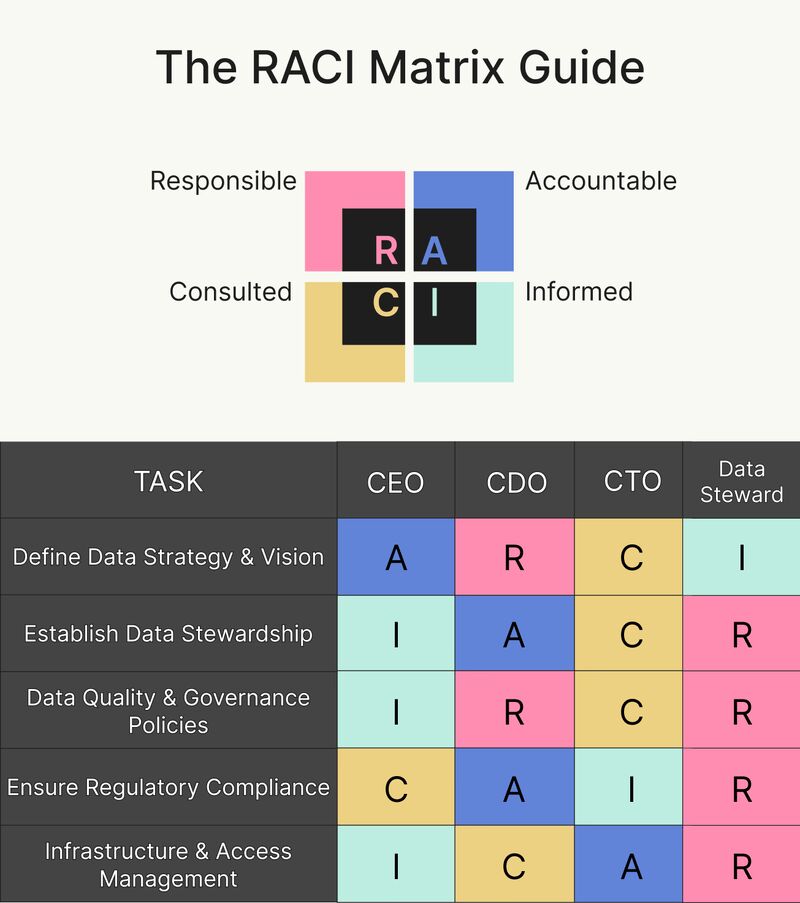
Have you ever used a RACI matrix to design a data governance policy?
RACI is a practical framework that stands for :
Responsible → Executes the task
Accountable → Owns the outcome
Consulted → Provides input or expertise
Informed → Is kept updated on progress
Often, there is a deadlock about policies in companies:
↪The CEO wants to ensure regulatory compliance but doesn’t want to get into technical details.
↪The CTO sees it as an infrastructure concern but doesn’t want to make policy decisions.
↪The CDO understands the risks but needs executive support to enforce the policy.
Everyone agrees it’s important, but no one owns it end-to-end. This is how most governance efforts fail.
In the visual below, I’ve mapped five key governance activities across the roles of CEO, CTO, and CDO using the RACI model.
If your data governance work is running into delays, and a lack of ownership is the underlying issue, then this framework is a simple way to fix that.
Learn more about the framework here: https://lnkd.in/eZNETjyb
MCPs have the potential to change data governance forever.
Context is everything in data governance, and unfortunately for many teams its spread across many tools.
A data steward might need to switch between documentation, quality reports, catalogs, monitoring dashboards, and APIs just to answer a single question or complete one task.
This is obviously time-consuming.
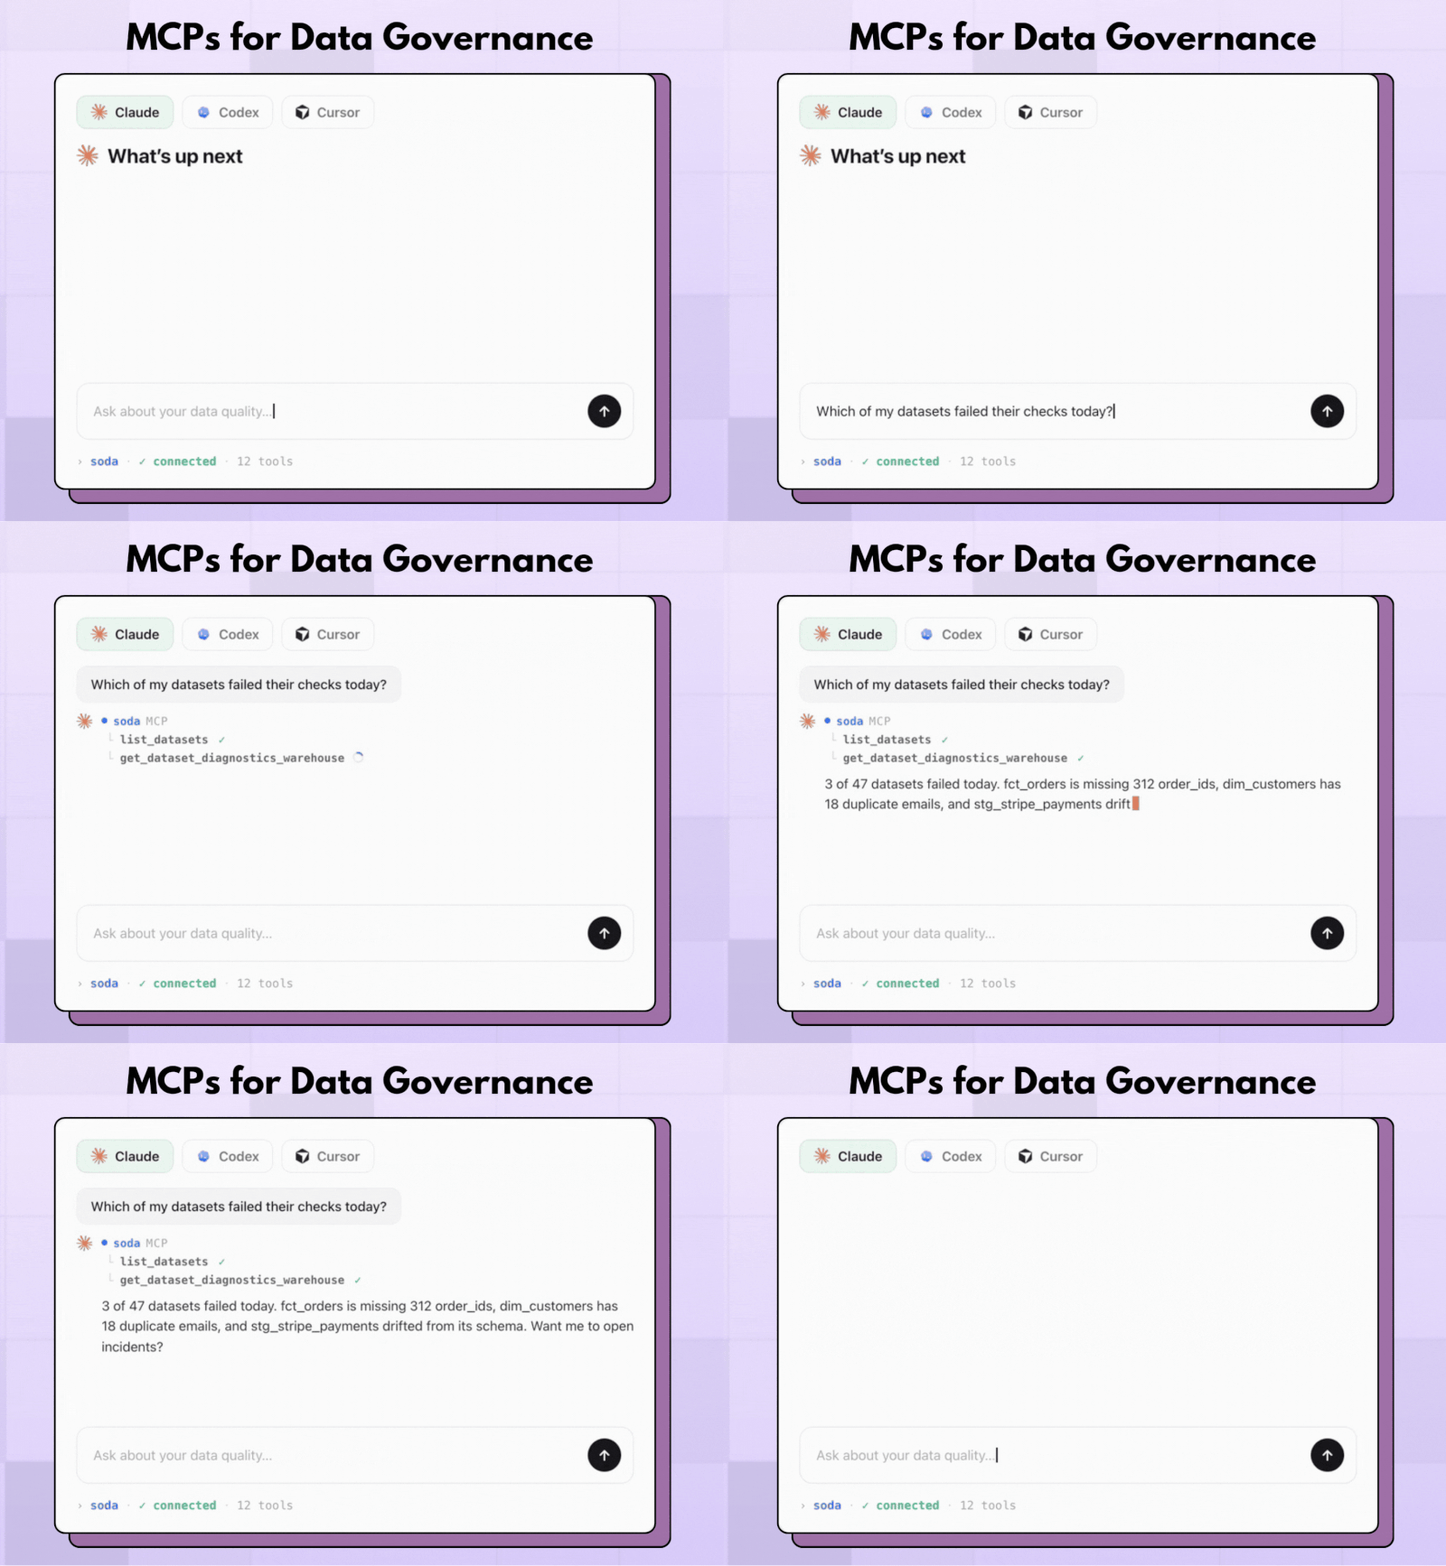
MCP or Model Context Protocol is an open protocol that gives AI agents a standard way to interact with external tools. Instead of only generating text, an AI agent can retrieve data, execute actions, and update resources through a defined interface.
This changes what AI can do for data teams.
Previously, AI assistants could explain documentation or generate code, but they could not directly inspect datasets, retrieve incidents, create contracts, or update governance resources without custom integrations.
Now MCPs make that possible.
Soda MCP brings these capabilities to Soda Cloud. Your team can manage data quality directly from AI clients such as Claude, Cursor, Codex, or GitHub Copilot.
With Soda MCP, an AI agent can:
1. Create and manage monitors.
2. Create and update data contracts.
3. List datasets and inspect their health status.
4. Retrieve checks, contracts, scans, and incidents.
5. Build workflows that combine Soda with other MCP-enabled tools.
and much more.
Save time on context switching and use MCPs.
Explore Soda MCP here: https://lnkd.in/ehn57sBB
Which data governance program should you start with?
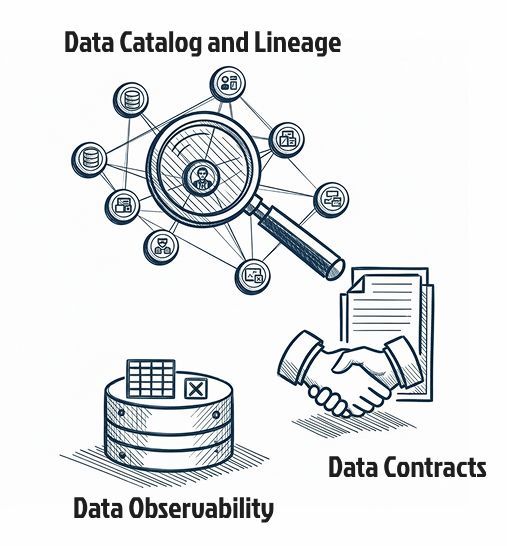
When time and resources are limited, I would focus on any of these three foundational areas that provide maximum impact:
➤ Data Catalog & Lineage:
A central inventory of datasets, including definitions, owners, and how data flows from source to consumption. This gives you the first layer of visibility.
➤ Data Quality & Observability:
Monitoring for anomalies, schema changes, missing values, and other issues that affect data quality. This would build the second layer for data reliability.
➤ Data Contracts
Explicit agreements between data producers and consumers that define expectations. This resolves many communication issues that governance aims to address.
Rule of thumb: Start with visibility, build reliability and then layer additional governance programs.
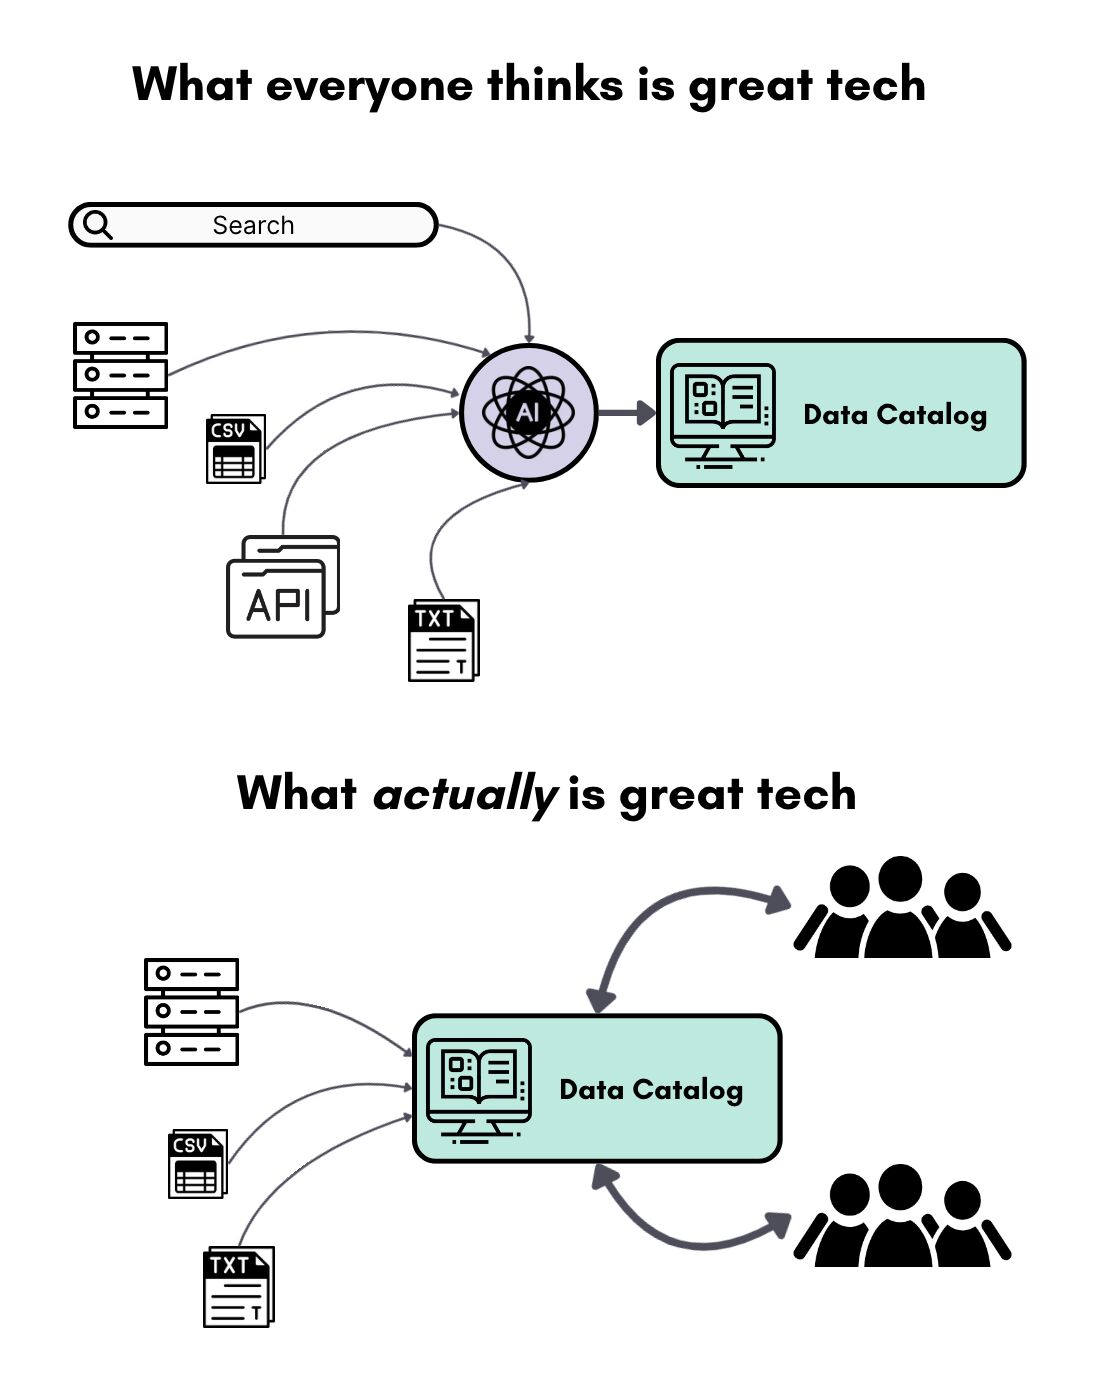
AI is changing how data catalogs work. New tools can do more like searching in plain language or handling unstructured data.
But no matter how advanced the catalog is, it won’t work unless people use it the right way.
In a recent post, Gaurav pointed out that strong features don’t replace the need for internal ownership and basic good practices. I’d take that further: many data catalogs fail because there’s no 𝗰𝗵𝗮𝗻𝗴𝗲 𝗺𝗮𝗻𝗮𝗴𝗲𝗺𝗲𝗻𝘁 plan.
Rolling out a catalog means helping people:
• Understand why it matters
• Keep learning as the tool changes
• Use it as part of their daily work
• Know who is responsible for keeping it updated
Without this, even the best tools turn into documentation storage. A catalog is only useful when teams trust it and rely on it.
Good tech is important. But lasting value comes from how people use it.
-----------
P.S. Speaking of great tech... I’ve got some exciting news coming up about what we’ve been building at Soda. Follow me to stay updated!
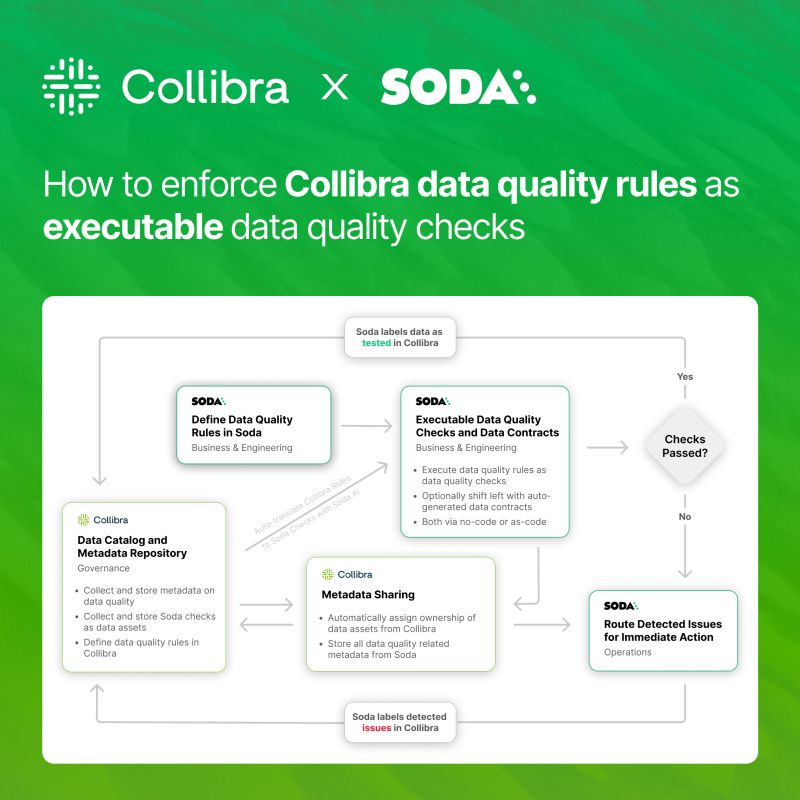
We’ve just released something exciting! The first bi-directional integration with Collibra.
In Governance, you have to define a data quality policy, then explain it to another team, duplicate ownership in both tools, and hope someone copies results back. 🫠
Now, with Soda’s new bi-directional integration:
• Write a policy in Collibra & Soda that turns it into a live data quality check.
• It will run it and send results straight back to Collibra.
• Roles and responsibilities stay synced in both tools.
100% no code.
If your goal is to make Collibra the single source of truth for both your governance definitions and your operational reality, this is how you get there.
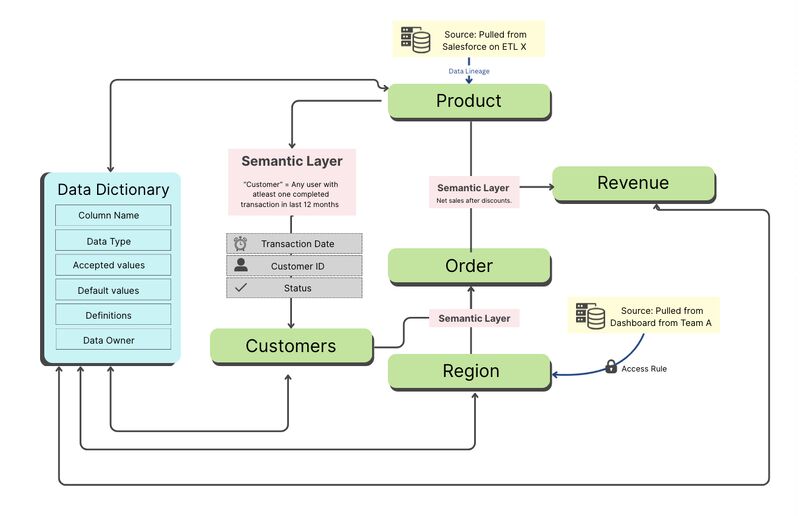
Data dictionaries lose their value fast. Do we still care about them in 2025?
We should. Because a well‑maintained data dictionary can be one of the most effective tools for governance.
A data dictionary defines every data element in your organisation: what it means, how it’s structured, where it’s used, and any constraints on it.
For governance teams, the value it brings is self-explanatory. But the rest of the team thinks of it as an extra chore.
The solution is to treat the data dictionary as a living product:
• Assign ownership for updates.
• Keep it connected to source systems wherever possible.
• Make it accessible and understandable to both technical and business users.
• Build it into day‐to‐day workflows so people naturally reference and update it.
A data dictionary is only a burden when it’s neglected.
The act of creating a data contract is the starting point of taking data ownership.
It's a declaration saying this is the data we promise to deliver and will keep up to date, whatever happens upstream or however we want to build our implementation.
Taking full ownership of a dataset includes:
👉 Creating and publishing a data contract will enable consumers to start consuming your data as much as possible in a self-serve manner, without the need to ask questions
👉 Establish a channel for consumers to ask questions, change requests or new feature requests
👉 Build, deploy and monitor the production implementation
In short, introducing data contracts will start with the question: Who should create and maintain the contract?
In that sense, data contracts help drive the notion of ownership and the architectural pattern of encapsulation.
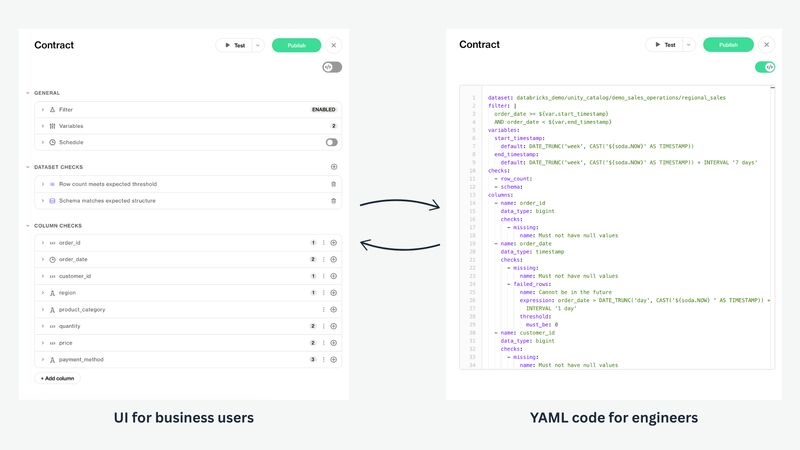
We built soda to allow for teams to collaborate seamlessly in the same contract: engineers work in git, business teams in the ui. Learn more about it here: https://lnkd.in/gtw8D6ji
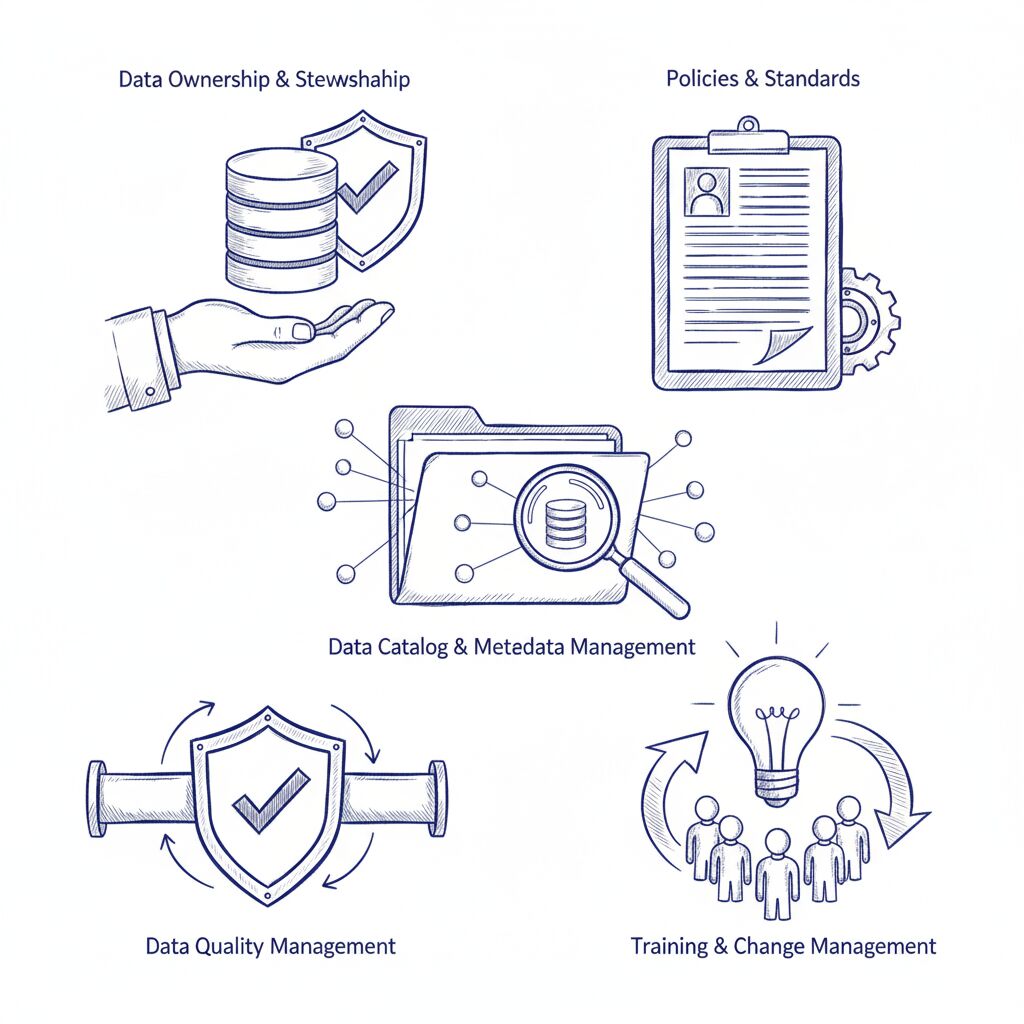
A governance program only delivers value when its components are alive and actionable. They must be embedded into workflows, decision-making, and culture from day 0.
To make governance components “living”, focus on how they operate in practice:
↪Data Ownership & Stewardship: Ensure owners can act on issues immediately, not just approve policies.
↪Policies & Standards: Documenting a policy isn’t enough; integrate it into workflows so teams follow it naturally.
↪Data Catalog & Metadata Management: Keep metadata continuously updated with automated lineage tracking and discovery tools. Teams should rely on it daily, not occasionally.
↪Data Quality Management: Implement continuous monitoring, anomaly detection, and feedback loops.
↪Training & Change Management: Educate teams through embedded processes and decision support, not just one-off workshops.
What would you add in this post as a governance leader?
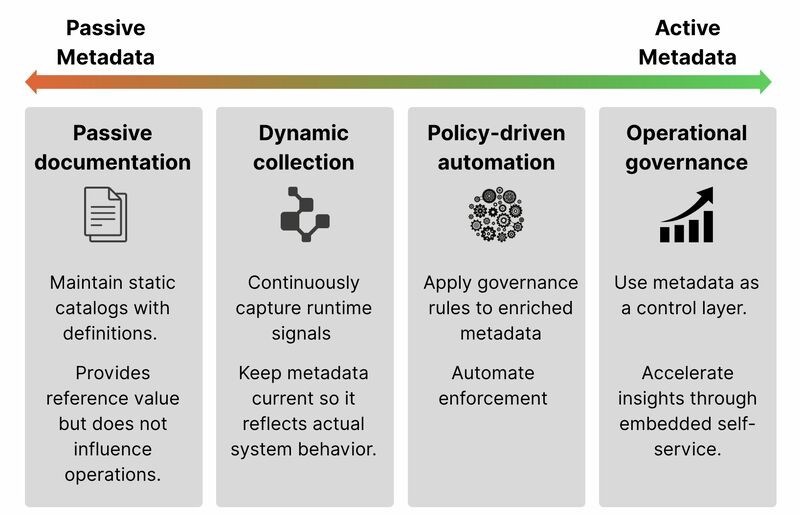
Metadata is now growing beyond passive documentation. It has the potential to become "active"
Active metadata is metadata that is continuously collected, updated, and used to automate operations in the data environment.
Some practical applications for data governance:
👉 Access control: if a dataset is labelled “Confidential,” access restrictions are enforced automatically across platforms.
👉 Data quality management: lineage and usage records can generate alerts when a pipeline fails.
👉 Resource optimisation: performance and usage statistics can drive archival of unused datasets.
👉 Business self-service: glossary terms, ownership details, and lineage are embedded directly into analytics tools.
For governance leaders, the significance is straightforward.
Active metadata transforms metadata from reference material into operational infrastructure.
What would you add to the visual?
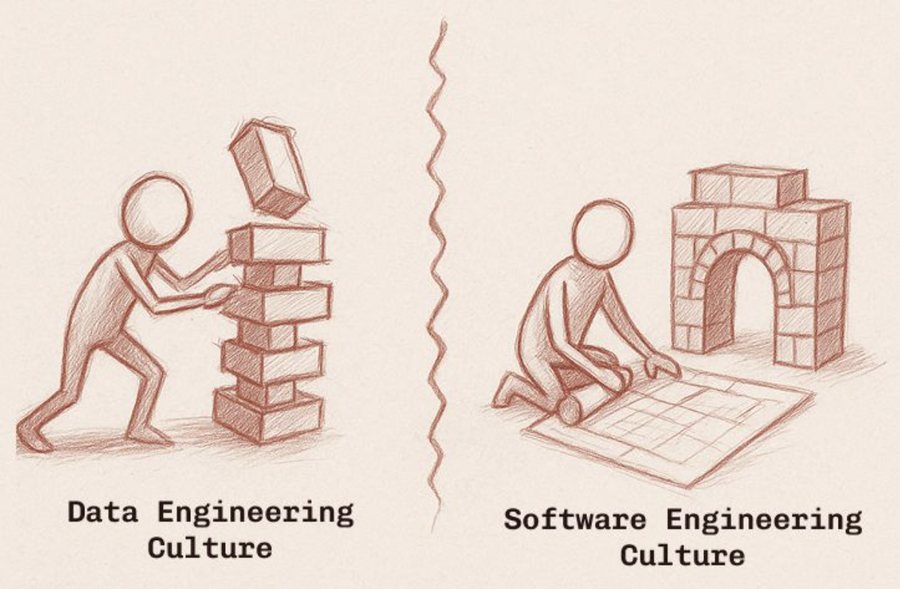
The gap between data engineering culture and software engineering culture is still large in many organisations.
Software engineers take for granted practices like version control discipline, structured code reviews and testing.
Data engineers often operate under different pressures.
The focus is on moving data, satisfying analysts quickly, and keeping pipelines running.
As a result, practices such as rigorous testing, reproducibility, and design reviews are often secondary.
In the longer run:
-> Data products are harder to maintain because pipelines evolve without the same guardrails.
-> Debugging costs are higher since reproducibility is weak.
->Collaboration with software teams is strained because quality standards differ.
Evolving toward S/W principles is less of a technical shift and more of an organisational one.
Leaders need to set the expectation that data engineering is engineering.
That means prioritising testability, reproducibility, and CI/CD pipelines over one-off delivery speed.
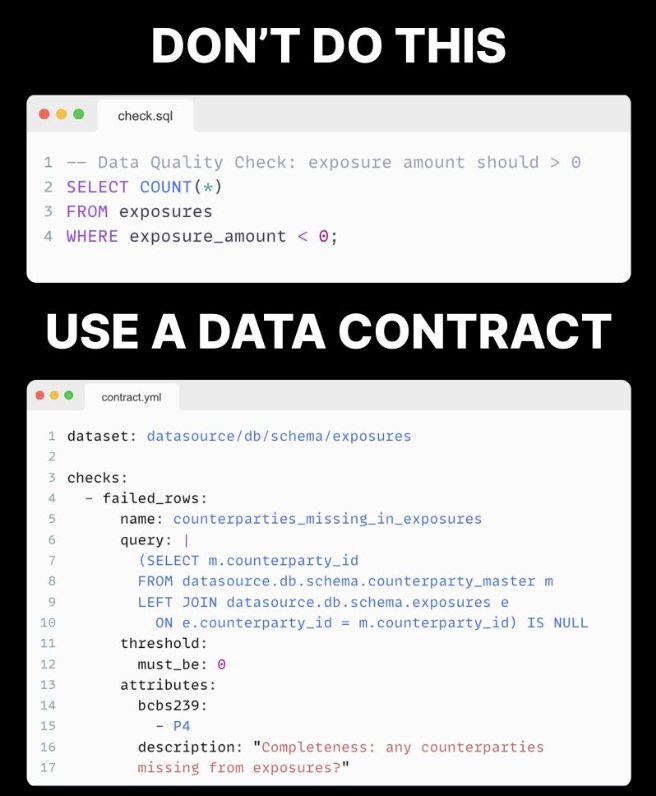
Let go of old-age data quality checks written in SQL.
Finance teams still rely on scattered checks written years ago.
They run in pipelines, dashboards, or scripts, but they were never designed for the scale and regulatory pressure modern financial data faces.
These checks create risks:
↪ Checks are scattered across with no single source of truth.
↪ Quality rules are not tied to regulatory controls such as BCBS239 or internal risk policies.
↪ Cross-dataset integrity is rarely enforced systematically.
↪ Ownership of checks is unclear, which delays investigation when failures occur.
Many of our customers are already moving beyond this model by adopting data contracts.
Data contracts introduce stronger guarantees for financial data:
↳ Dataset ownership and expectations are explicitly defined.
↳ Quality rules are stored with the dataset and tracked over time.
↳ Relationships between financial datasets are validated automatically.
↳ Financial balances and aggregates are continuously checked.
↳ Schema and rule changes become visible and controlled.
We have added 5 new data templates for finance-specific issues in our gallery:
➤ Transaction ledger
➤ Account balance
➤ Portfolio holdings
➤ Fraud detection model outputs
➤ BCBS 239 risk exposure
Each template includes real-world failure scenarios and executable Soda contract examples that you can use right away!
Get started here: https://lnkd.in/e_ayZzmz
Why is YAML the best language for data contracts?
A data contract is a formal specification of a dataset. It defines field names, data types, allowed values, nullability, and constraints. These definitions must be explicit, readable, and easy to change over time.
YAML is well-suited to this because its:
• natively compatible with Git-based version control
• core structures directly match contract requirements.
• readable by data engineers, analysts, and domain experts
• does not require dependency management or runtime configuration
• supports pull request review, line-by-line diffs, and version rollback
• requires only correct structure and indentation, not programming knowledge
For data engineers, this replaces long email threads about requirements with structured pull requests that can be reviewed, tested, and merged.
We hosted a webinar that goes in-depth on how to get started with data contracts and integrate them into pipelines.
Watch the recording here: https://lnkd.in/etYuFfr3
Data contracts solve 4 architecture problems that data quality tools never could
A data contract is a formal specification of a dataset that includes schema, constraints, ownership, and validation rules, enforced automatically during data movement.
➤ Grouping at the dataset boundary : Validation logic is often scattered across pipelines and queries. Data contracts attach all rules directly to the dataset boundary. This creates a single control point per dataset instead of distributed checks.
➤ Binding validation with metadata and ownership: Contracts combine schema, documentation, and ownership in one structure. This links validation rules to definitions and responsible teams at the architecture level, not as separate artifacts.
➤ Gate enforcement in the pipeline: Contracts act as control gates in ingestion and transformation layers. Data must satisfy rules before moving forward, which prevents invalid data from entering downstream layers.
➤ Extensible control layer: Contracts can be extended with new rules and fields without changing pipeline structure. This adds a consistent control layer that scales with new datasets and requirements.
Soda is the only tool that allows to operationalize Data Contracts at scale. Learn more here: https://lnkd.in/eEcQTqzP
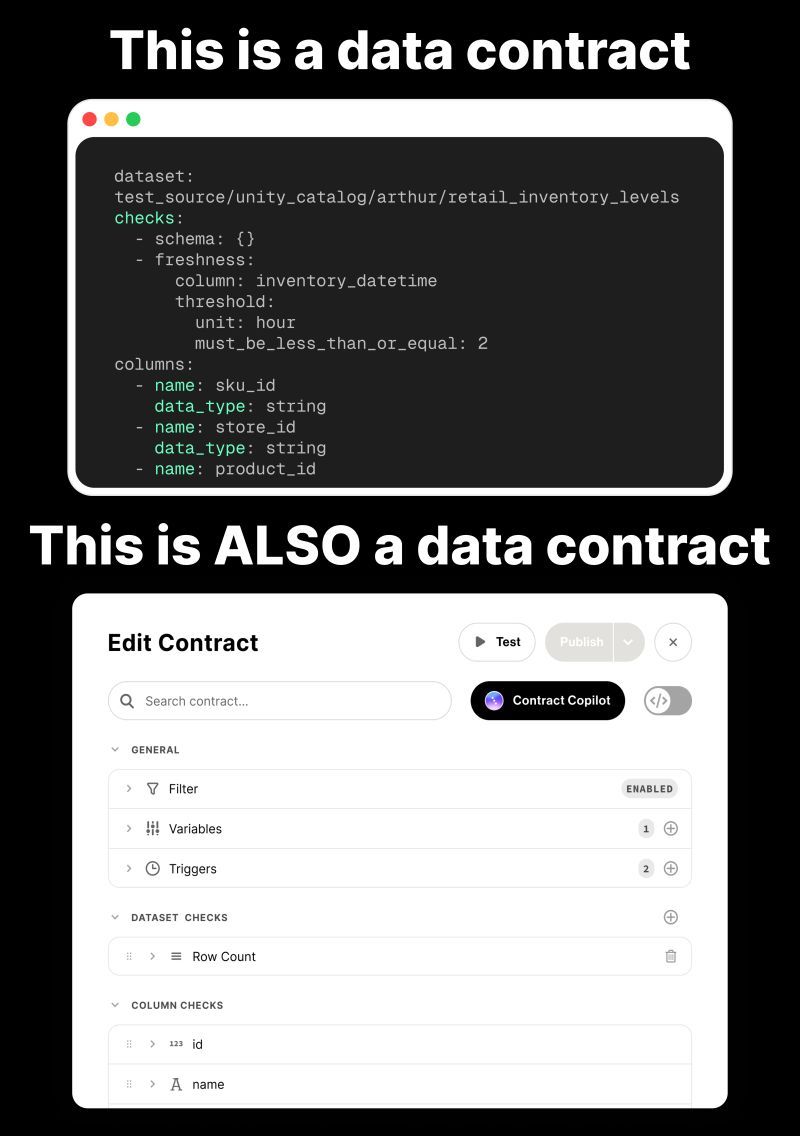
But why add a UI to data contracts? Aren’t they for data engineers?
(We believed that too.)
The thing is, most data quality issues don’t come from code. They come from data standards changing frequently, with no structured handoff or communication.
We built data contracts into the Soda UI to close the loop between those who create data and those who rely on it.
With this:
• Both sides agree on column names, formats, and update schedules before pipelines run.
• Business users do not need to write YAML. They can review and suggest expectations through a form.
• Engineers can still manage contracts in code. Changes stay synced with the UI.
This helps teams avoid surprises and turns contracts into something that everyone can work with, not just engineers.
We are hosting a webinar on how to get started with ai agents and data contracts in production!
Register here: https://lnkd.in/eEv-4z52
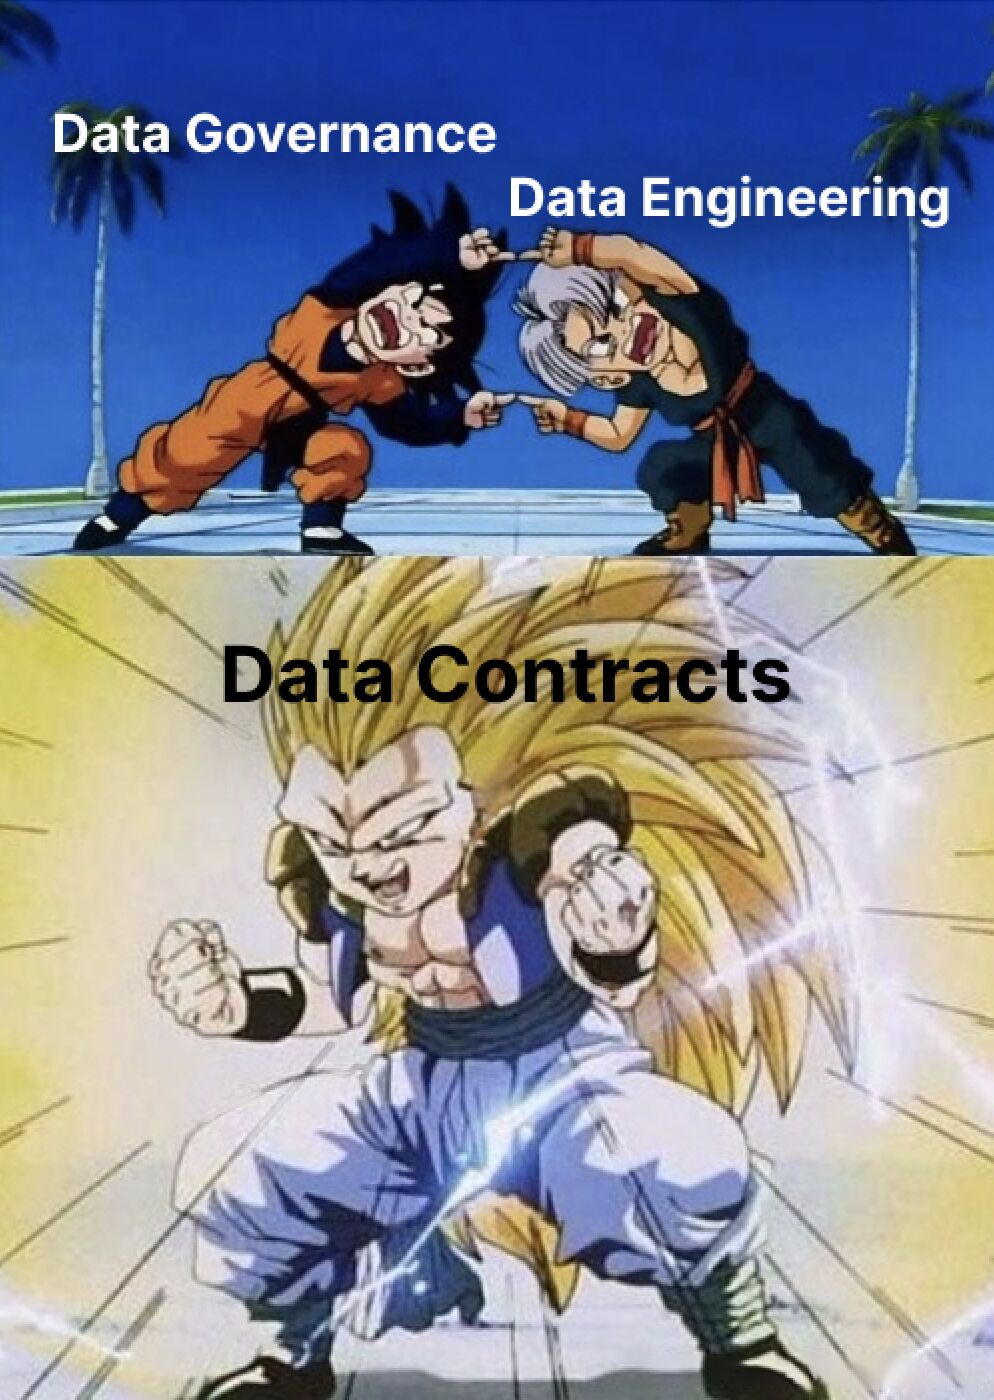
Data contracts is Governance packaged as Data Engineering.
Traditional governance has struggled in data teams.
Policies are often written in documents that engineers rarely read, and enforcement depends on manual reviews.
Data engineers always see it as extra paper work.
Data contract is a formal agreement that specifies the schema, semantics, and expectations from a dataset. It defines what fields exist, their data types, update frequency, and quality thresholds. This is governance.
It is enforced through code. It validates data deployment, and monitors production datasets. This is engineering.
Leaders get direct value on building contracts is because they close the gap between policy and implementation.
Producers and consumers operate on the same definition of what good data means.
Manual governance would simply never scale the way data contracts do.
Learn more here: https://lnkd.in/g8GMWCUf
Data contracts were always meant to do more than block bad data.
The problem that we at Soda have been trying to fix now is cleaning data. So can data contracts make that possible?
A data contract is a specification of what correct data looks like, including schema, constraints, and valid values.
They are imagined to only function as gatekeepers of a dataset. When it fails to verify, it pauses the data pipeline.
BUT IT CAN DO MORE with the latest Soda's Cleanse.
Soda Cleanse is contract-driven, agent-specialized, and human-approved. These three properties distinguish it from generic AI data cleaning approaches, and from the ad-hoc scripts most teams fall back on today.
A customer who adds a new check gets the remediation slot for free: they fill it in when they're ready, and Cleanse picks it up automatically.
Four outcomes fall out of that:
▶️ Detection and remediation live inside the same data contract, so they can't drift apart.
▶️ No team needs to grant production write-access on day one to get value out of Cleanse. That conversation can wait until you're ready for it.
▶️ Advanced, interpretable heuristics pick the most likely correct record, and LLMs step in only to resolve ambiguous cases. E
▶️ Every decision — proposal, approval, write, rejection — lands in an immutable audit log. When an auditor asks, "Who changed this record and why?" the answer is already there.
🟥 Check it out here: https://lnkd.in/d3d4YZr8
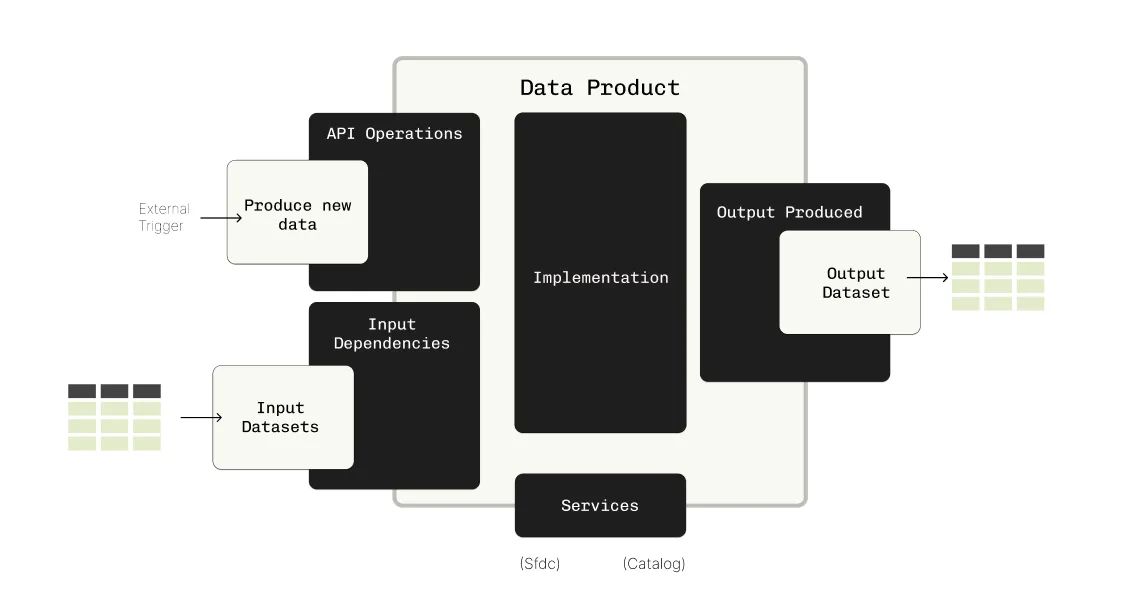
Data mesh often feels like an abstract concept that’s hard to move from theory into practice. That’s largely because we don’t treat data products as software engineering components.
A more practical approach is to treat data products like deployable, testable components. Not just datasets.
Most companies try to apply data mesh principles on top of legacy infrastructure. Instead:
• Assign clear ownership of each data product to a single team
• Expose a defined interface typically a table or API so downstream teams know what to expect
• Include metadata: freshness, lineage, schema, and documentation
• Define SLAs/SLOs: update frequency, delivery windows, error budgets
• Version and deploy via pipelines, just like software
• Emit observability signals: latency, volume, anomalies
Making data mesh executable starts here: by designing infrastructure that enforces its principles.
How are you defining “data product” in your team?
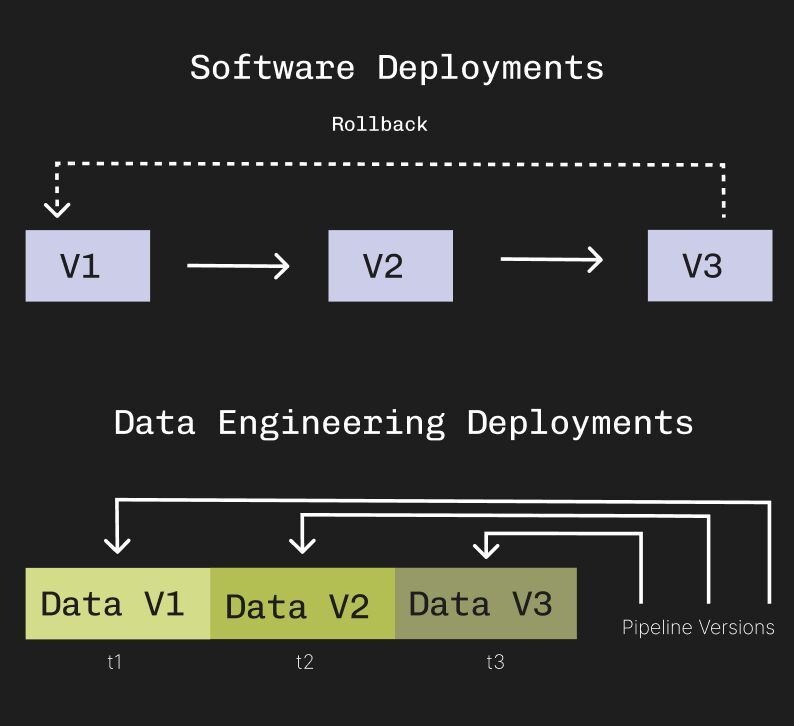
Data engineers are missing out because they don’t follow the same deployment lifecycle as software engineers.
In software engineering, a new release replaces the previous one.
If something fails, rollback is straightforward: redeploy the old build or revert to a prior version in Git.
In data engineering, deployment works differently. When a pipeline changes, it only affects data created after the update. Previously processed data does not automatically change.
This distinction means data engineering requires additional practices like:
👉 Storing every dataset output with a version tag
👉 Automating backfill jobs so that when pipeline logic changes, prior data can be reprocessed.
👉 Integrating a lineage tool into CI/CD so each deployment produces an updated dependency graph.
Data engineering needs deployment practices that treat both code and data as first-class assets
Data ownership takes effort. And people.
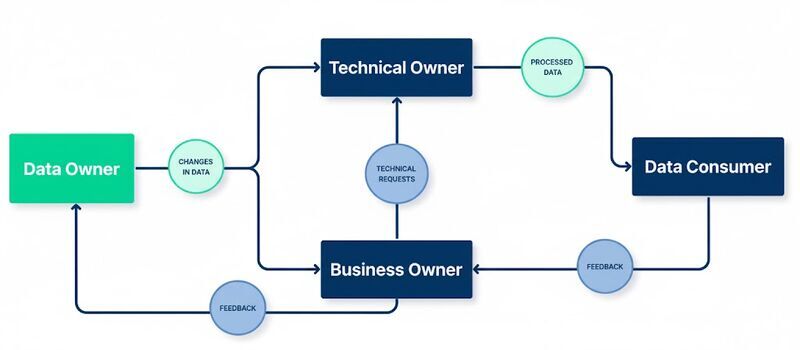
Data ownership is not just about having some guy be the owner of a data product. It needs a systematic approach, standardized procedures and, more importantly, people.
One-person teams aren't a thing.
A data owner has to be a data producer. That means they should have a say on how data evolves over time.
Also, having a say doesn't necessarily mean building the pipeline from scratch and be the one who hits "run".
Ideally, a data owner will be a business leader who is responsible and held accountable for their data.
There will be someone below who is the technical owner. They'll be the ones tweaking pipelines and running them.
But that's not all. Business owners, like product managers or operations managers, are also essential to fulfill data ownership.
They're the ones talking to data consumers and having calls to figure out their data needs so that technical owners can focus on what they do best.
This structure will look different depending on each organization's size, complexity and needs.
But Data Quality is not just about good pipelines and automated checks.
It's also about building teams and optimizing communication among people.
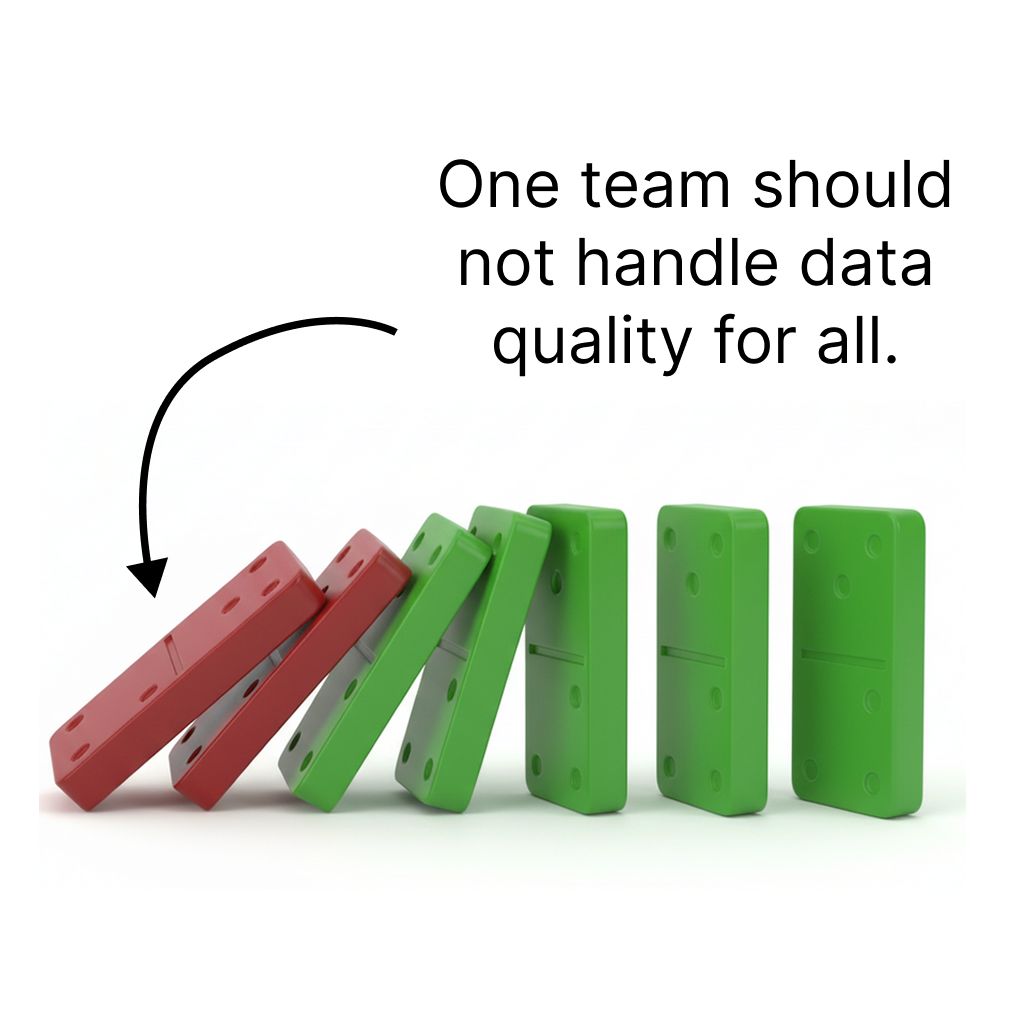
Data quality cascades into failure when one team tries to manage it for everyone.
One bad schema change, one missed check, and downstream pipelines collapse for dozens of teams.
Centralized quality management creates bottlenecks. The managing team becomes overloaded, while the teams producing the data have little incentive or ownership to improve it.
Decentralized data quality brings:
-> domain ownership since each team would validate the data it produces
-> data testing at the source.
This approach scales better.
Problems are caught earlier, pipelines fail less often, and accountability sits with the team that knows the data best.
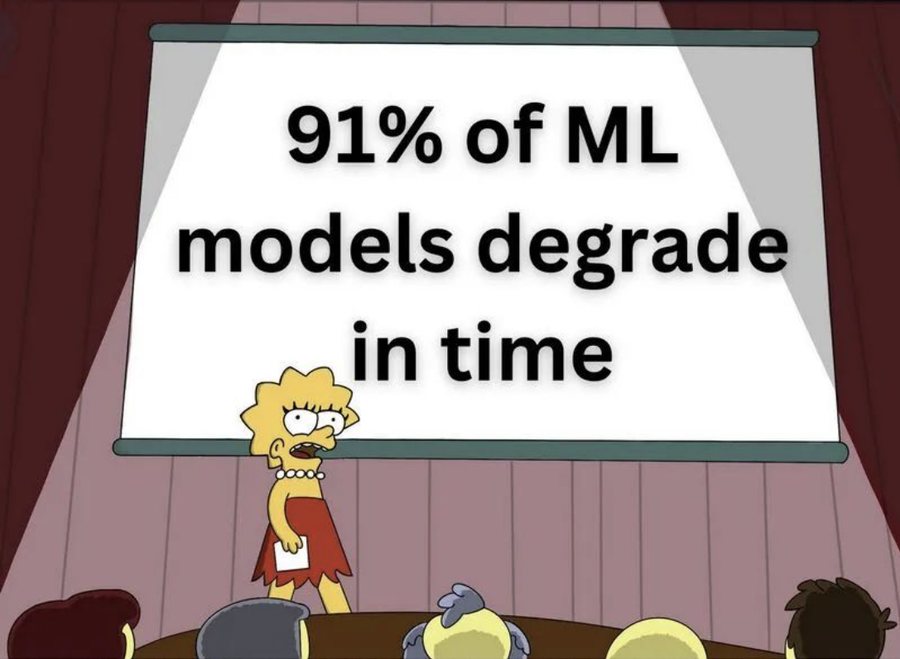
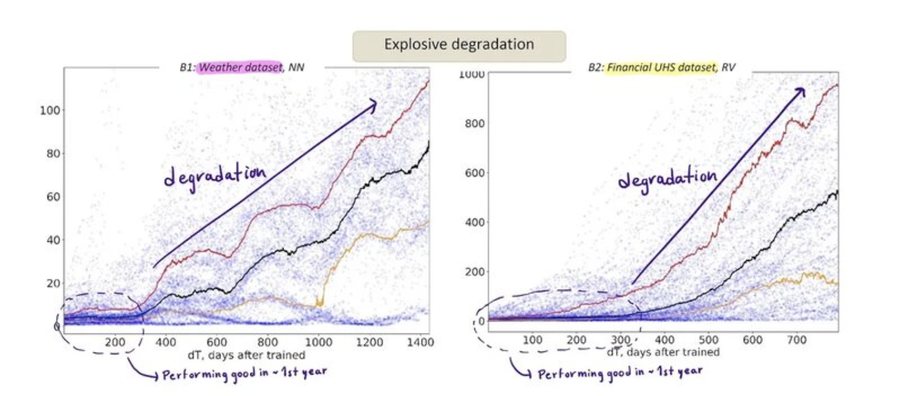
91 % of ML models degrade in time.
A Nature paper from top universities (including Harvard and MIT) demonstrates model degradation for 91% of models.
Few key quotes from the paper:
→Temporal degradation in ML model quality presents a serious challenge that cannot be explained by the temporal drifts in the underlying data alone.
→Second, temporal model degradation can develop gradually but can also escalate very abruptly after a significantly long period of good model performance. Moreover, this “breakage point” cannot be explained by any particular change in the data.
→Some models can perform reasonably well “on average”, but the variability of their error values can significantly grow or fluctuate with time.
What does it mean?
1️⃣ Your models will almost certainly degrade in production.
2️⃣ You need to always monitor the performance of your models.
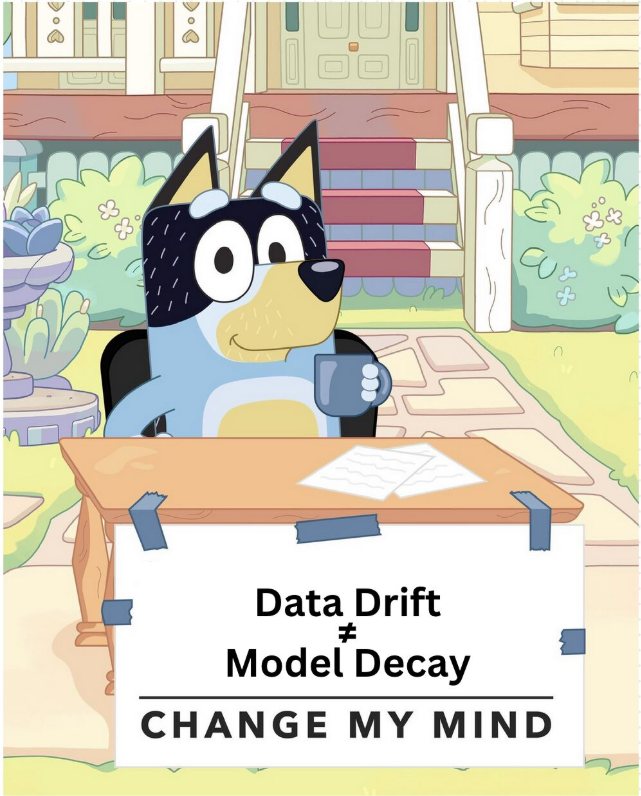
3️⃣ Data drift monitoring is useful as a diagnostic tool but cannot replace performance monitoring.
The easiest way to get started with performance monitoring is NannyML, our OSS python library. Link to the full paper in the comments!
Data drift Is NOT a proxy for ml model performance.
We see a lot of people asking how to monitor data drift and retrain ML models when drift happens.
But here’s the thing: Not every drift affects how well your model works.
Here are three things that can happen as a result of data drift:
- Model performance stays the same (shift happens in similar areas)
- Model performance improves ↗️ (data moves to certain areas)
- Model performance gets worse ↘️ (likely, the data moved closer to the class boundary)
That’s why it’s better to track estimated performance metrics instead of only looking at data drift.
Data drift detection is not the bad guy here. Let’s stop treating it as an automatic alert and focus on what really matters: model performance.
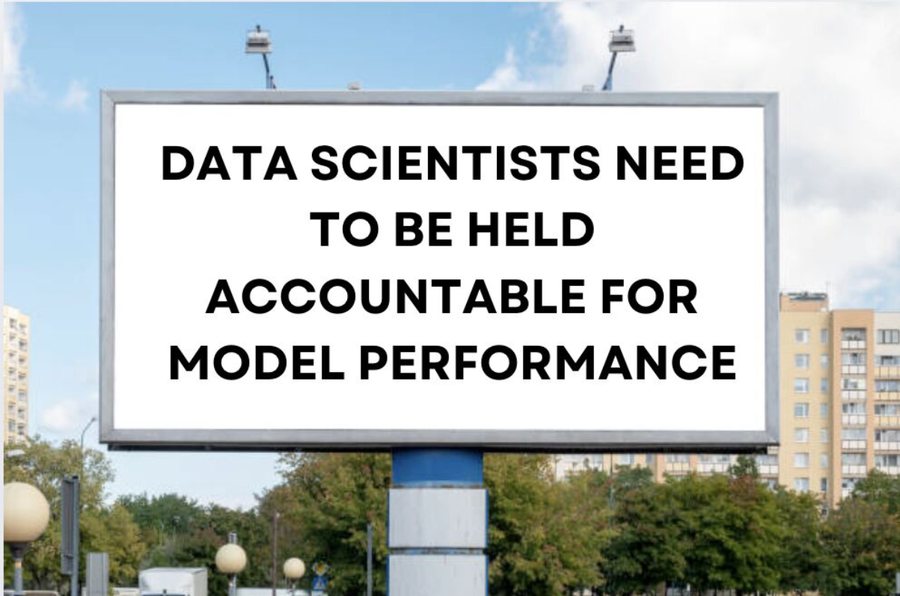
Are data scientists becoming model owners?
Creating models is just the first step. With AI adoption on the rise, data scientists are now expected to take charge of their models’ performance, moving beyond operational tasks to strategic oversight.
Who better to own this responsibility? They’re the ones who prepared the training data and built the models. They understand the details and are in the best position to foresee where things could break down.
Long-term success requires actively watching for drift, predicting weak spots, and adapting models and data as trends evolve.
Data science is shifting from just building models to truly owning them. What’s your take on this transformation? Let’s discuss!
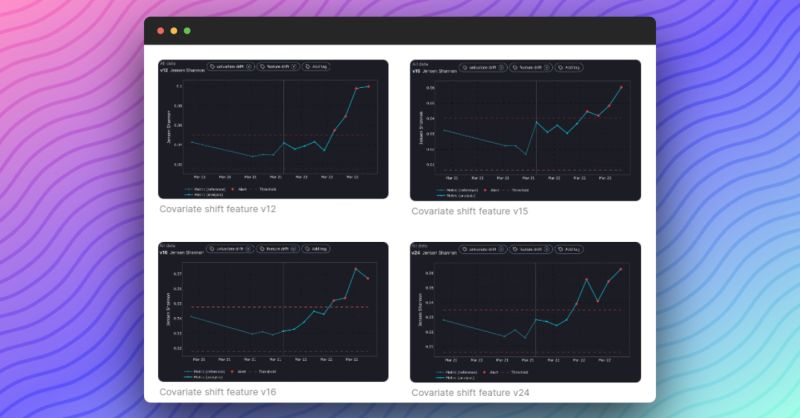
Data scientists are spending more and more time maintaining their models
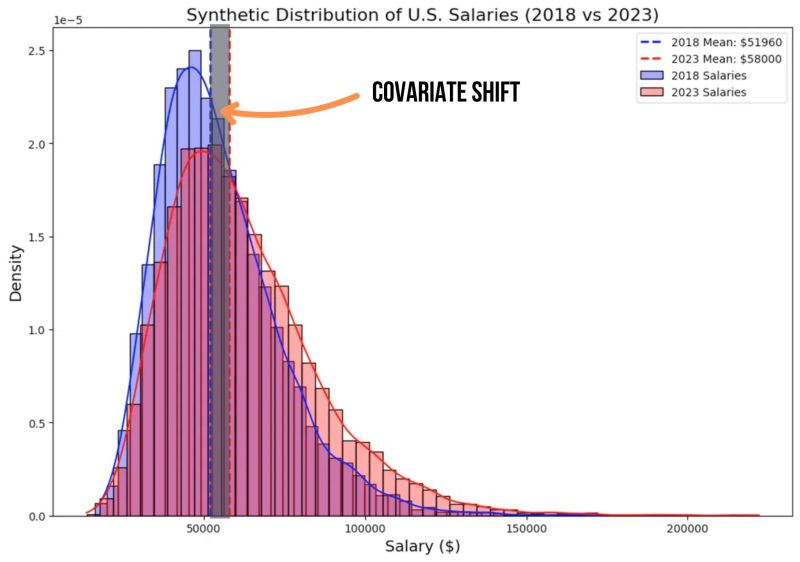
and most of the time, it’s because of covariate shift.
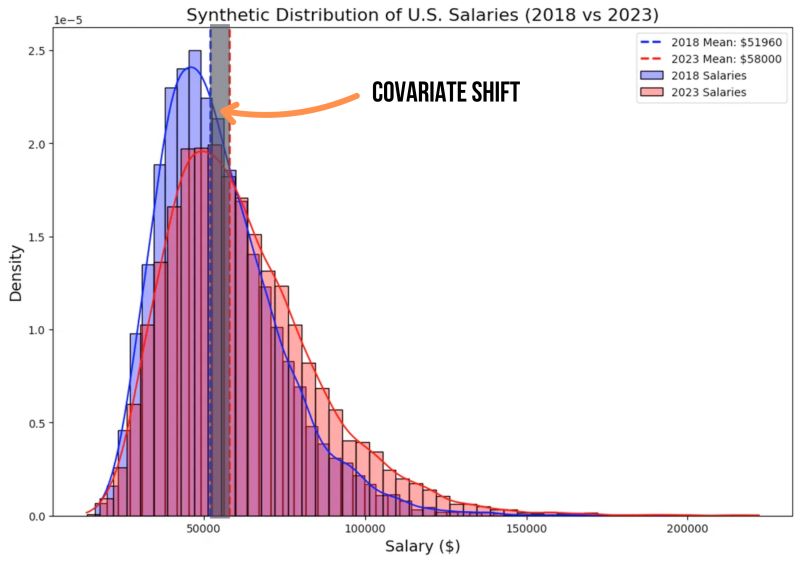
A covariate shift occurs when the distribution of your model’s features changes while the relationship between inputs and outputs stays the same.
Covariate shift can be univariate or multivariate, each having its own drift detection methods.
The mistake most data scientists make is equating covariate shift with performance deterioration and spending most of their time looking for this drift.
Instead, the smarter thing to do is to estimate performance through continuous monitoring.
Once you’re alerted to a drop in performance, you can investigate if drift was the main culprit.
How do you currently handle covariate shift? Are you monitoring for it, or starting with performance estimation first?
All the effort in training an ML model only counts if they deliver good performance in production.
Deploying an AI model is easier than ever. What’s hard? Tracking, monitoring, and maintaining performance in production.
Why is that?
Because AI models age. Studies show that 91% of models degrade over time due to factors like covariate shift and concept drift. That means the errors in the predictions increase as time passes.
Waiting until performance declines is not an option. Businesses can't afford that risk.
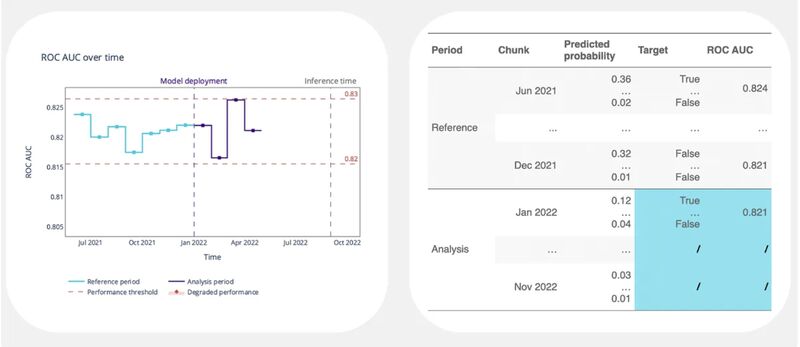
That’s why proactive monitoring matters. Algorithms like CBPE let you estimate performance even without ground truth, so you can act before it’s too late.
Monitoring and maintaining is not something you think of once your model is deployed. You need it from day one.
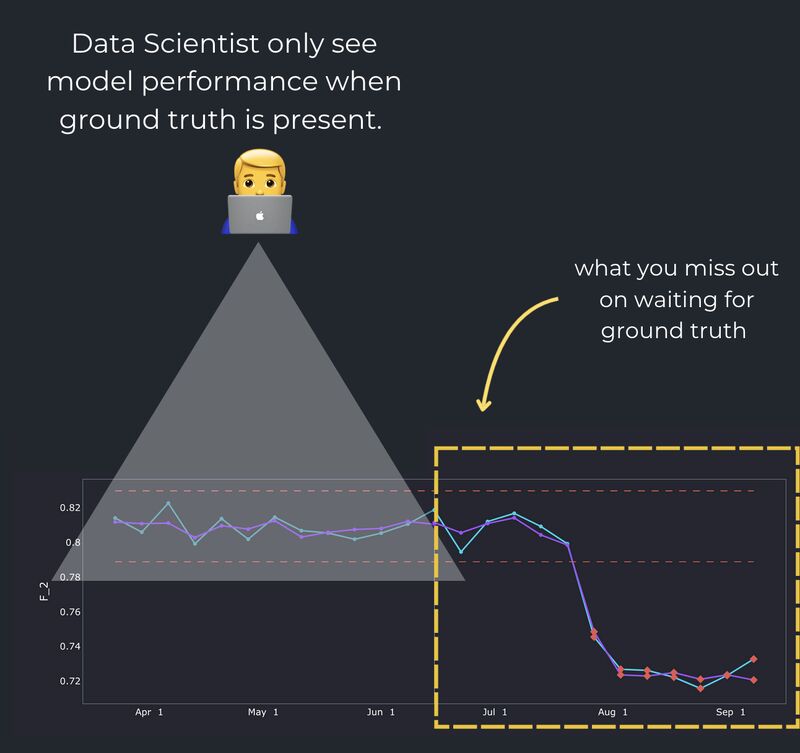
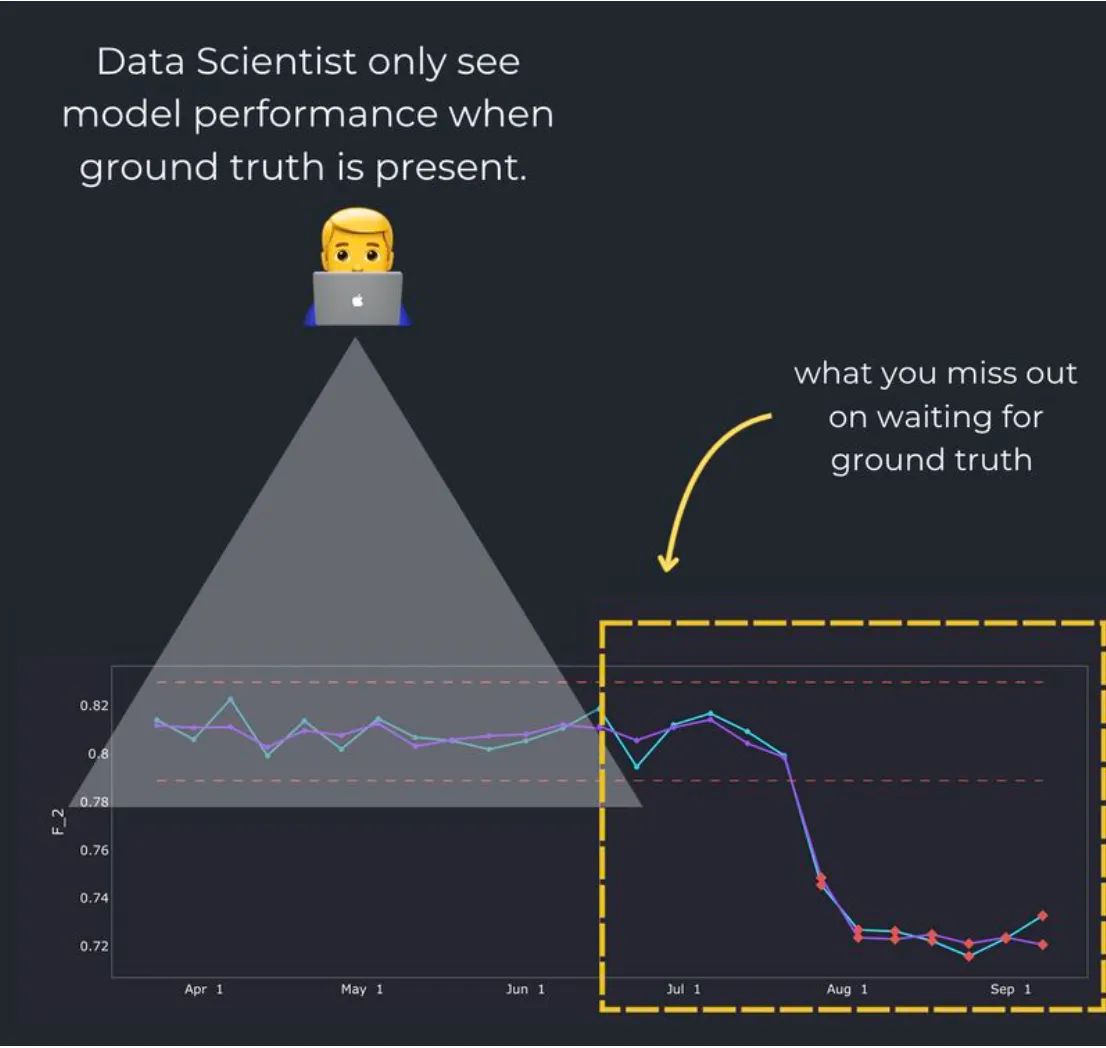
Data scientists often assess model performance only when ground truth labels are available. 👨💻
But what happens during the gap between predictions and reality?
That blind spot can leave you unaware of critical performance drops or unexpected shifts. These gaps can cost your team time, resources, and, more importantly, trust in the model.
In machine learning, waiting for ground truth is like driving a car while only watching the rearview mirror. To stay ahead, you need insights into performance as it happens.
Performance estimation bridges this gap, giving you a real-time estimation of how your models are doing even without labels.
How are you handling the blind spots in your model’s performance?
There is a huge issue with ML models that nobody talks about.
Models fail silently.
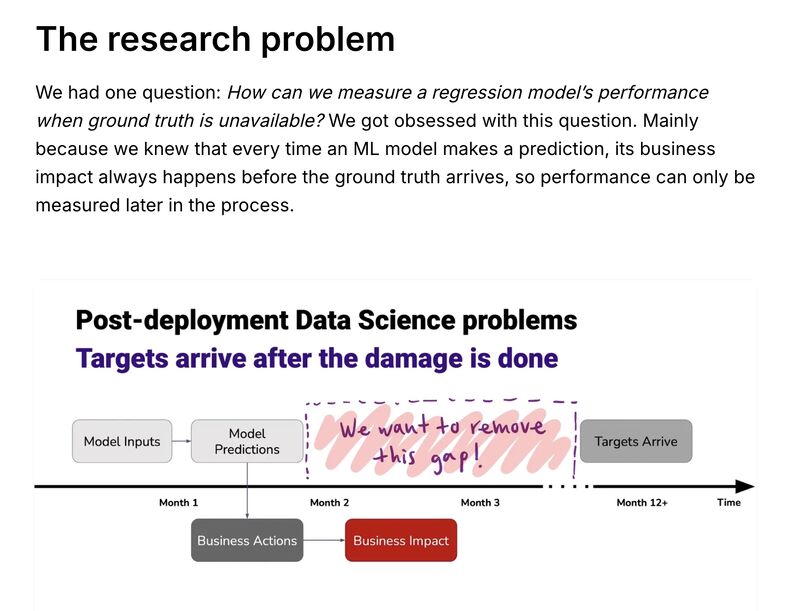
Targets (the actual outcomes) often arrive weeks or even months after the model has made its predictions.
During this gap, the model could have started failing, but no one knows.
The result? Businesses suffer.
About three years ago, we decided to tackle this problem and reduce the gap as much as possible.
During this research, we invented a new algorithm to estimate the performance of ML regression models. This means we can calculate the expected values of regression metrics without having to wait for targets.
In this blog post, Santiago Viquez summarizes all the research that went into creating this algorithm. Check it out—it’s a fun read: https://lnkd.in/dcbssVxr
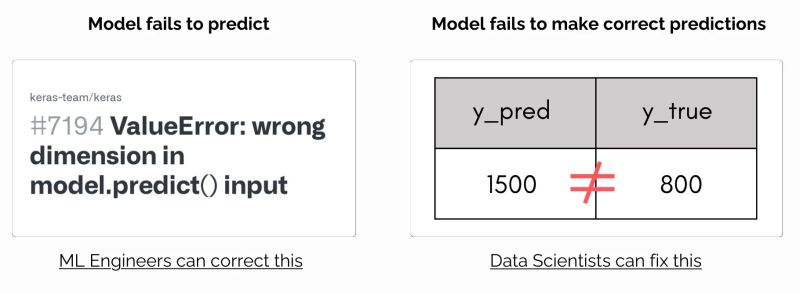
ML Engineers vs. Data Scientists: Who fixes what?
When a model fails, the problem usually falls into one of two categories:
The model doesn’t run. This is often an ML engineering issue.
The model runs but produces incorrect predictions. This is usually a data science issue.
ML engineers handle problems like missing dependencies, incorrect tensor shapes, and broken pipelines.
Data scientists focus on model performance—fixing biases, tuning hyperparameters, and refining feature engineering.
What kind of issue do you see more often?
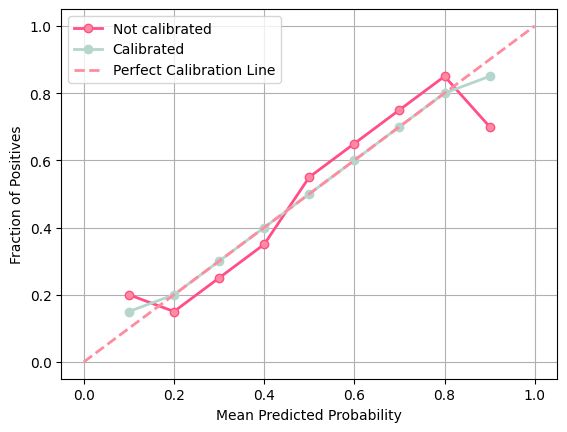
not every machine learning model needs perfect calibration
take ranking problems, for example
when you're ranking news articles by relevance, the exact probability of each article being high-quality isn't the focus. What matters is that the top-ranked article is better than the others
calibration? not so important here
another example is document classification
the goal here is to categorize documents correctly, not to provide precise probabilities for each category
as long as the model's classification is accurate, the exact probability scores are secondary
depending on the use case, calibration can be justified—or just unnecessary.
Can you think of other such scenarios? Let me know in the comments.
---
Find a full explanation here: https://lnkd.in/estBT49T
Follow me for more post-deployment data science content
Data scientists know that model deployment is not the end of their job.
Machine learning models degrade with time and data drift is a common reason why.
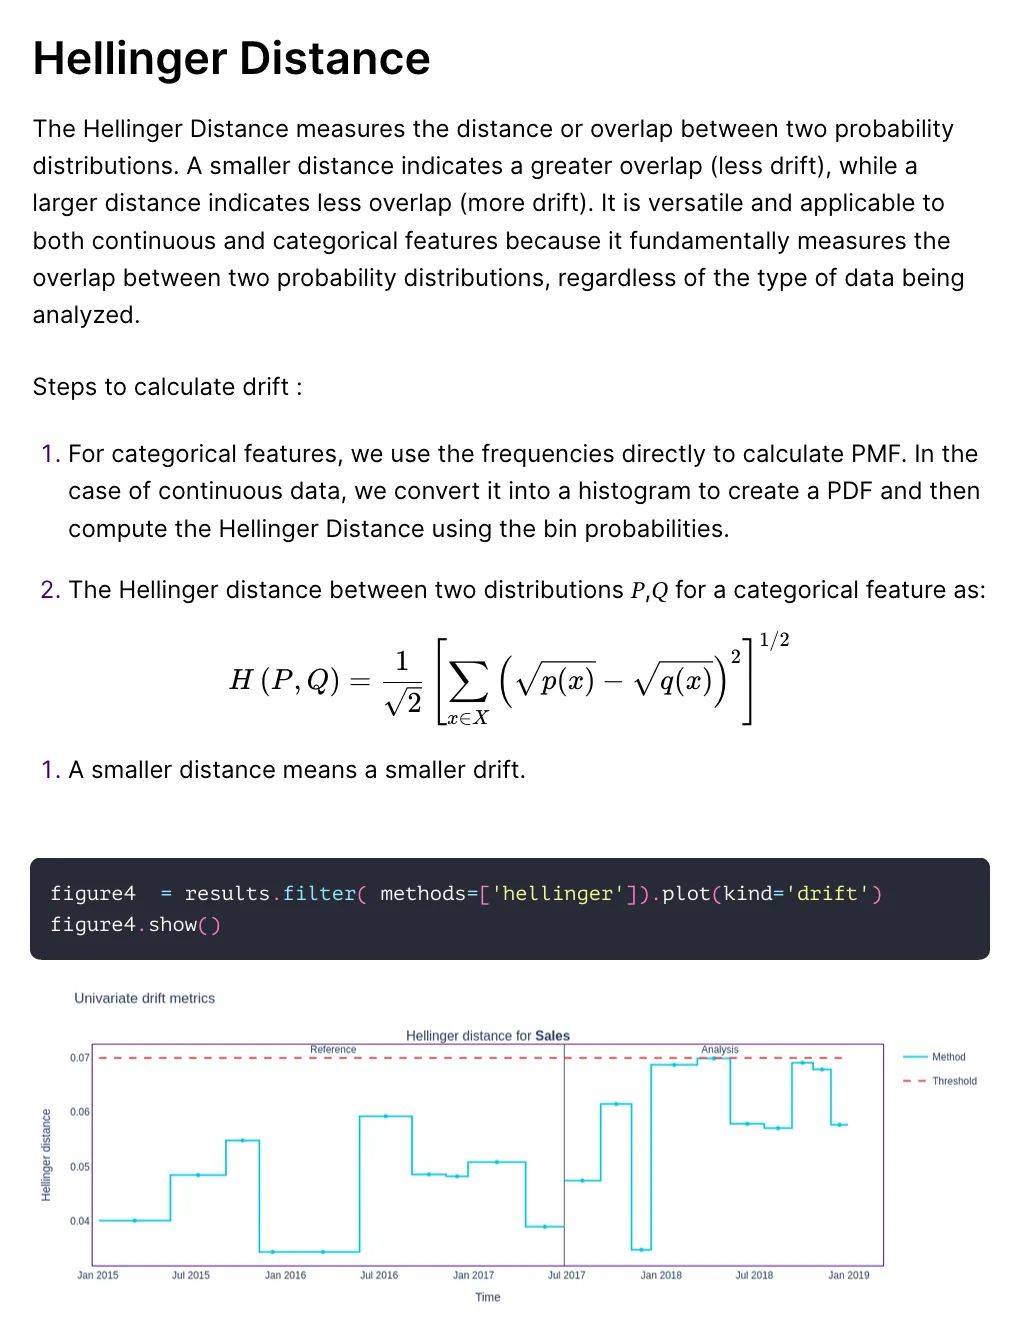
So how can we detect data drift? A popular univariate drift detection method is hellinger distance.
It measures the distance between two probability distributions.
A smaller distance indicates a greater overlap (less drift), while a larger distance indicates less overlap (more drift).
It is versatile and applicable to both continuous and categorical features because it fundamentally measures the overlap between two probability distributions, regardless of the type of data being analyzed.
Pros:
→ Recommended to use in case of medium shifts
Cons:
→ Breaks down in extreme shifts
→ In cases where the amount of overlap stays the same but drift increases, this will not detect the change.
Hellinger Distance is a valuable tool for data drift detection, but no single method is perfect. What other methods have you used?
One of the core challenges in monitoring demand forecasting models lies in the fundamental nature of time series data.
Time series models draw on patterns from the past to forecast the future.
They depend on the idea that historical trends, seasonality, and relationships between variables will continue as they have before.
Yet, the world around us is full of surprises.
Economic shifts, market changes, and evolving consumer behaviors can all disrupt these patterns, making the future less predictable than we might hope.
When this happens, the model may start to drift.
A ML model experiences data drift when the relationship between its input variables and the target variable changes, even if only slightly.
Over time, these small inaccuracies can accumulate, resulting in forecasts that are no longer reliable.
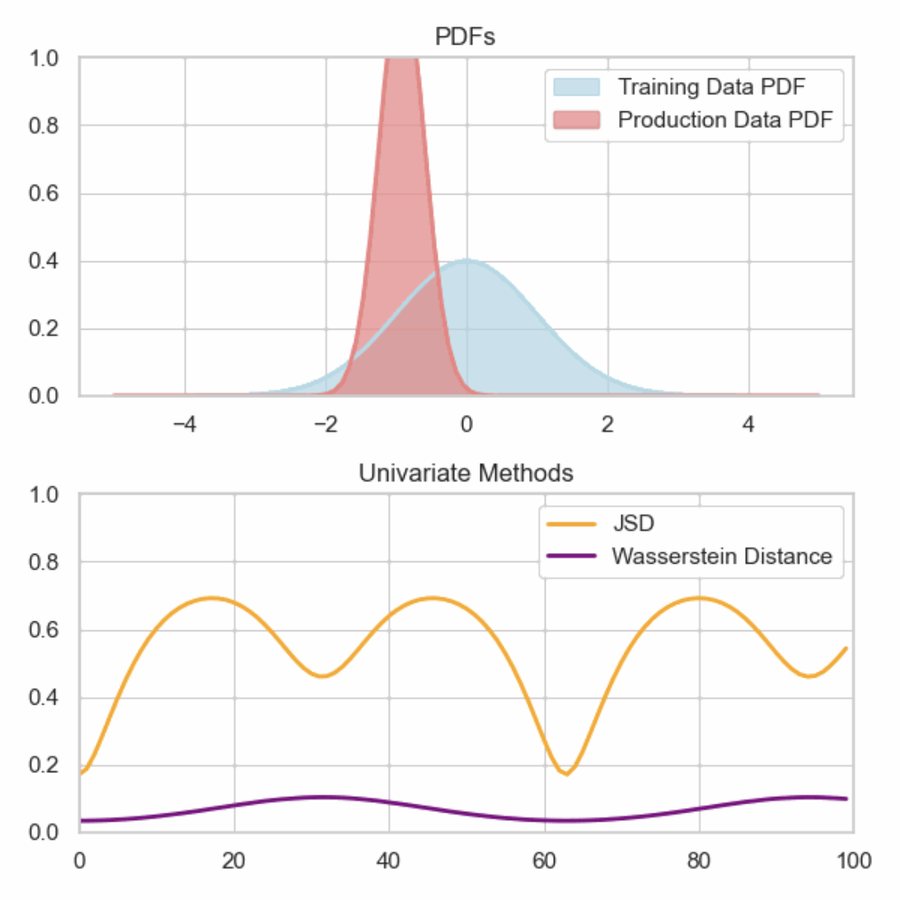
Univariate drift detection focuses on detecting changes in the distribution of an individual feature. It involves comparing newer data distributions to older ones to spot deviations or shifts.
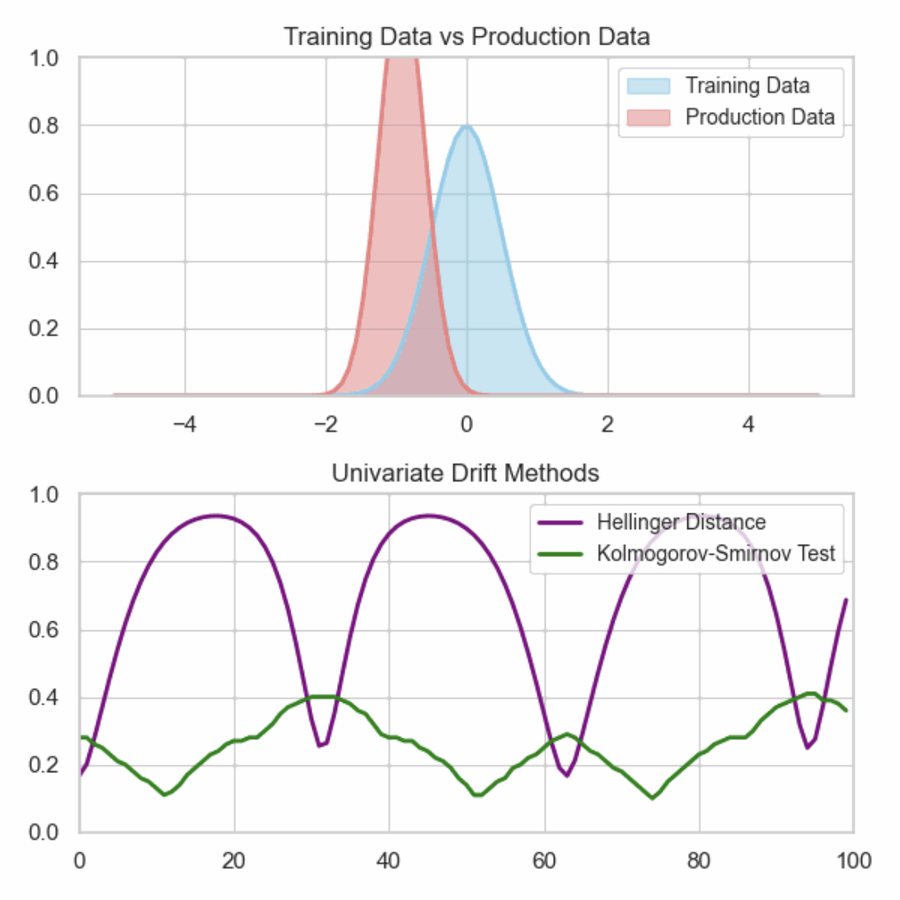
I have discussed JS and Wasserstein before, so lets have a look at two more methods : Hellinger Distance and the KS test.
Hellinger Distance measures the overlap between two distributions.
✅ Works well for both continuous and categorical features. Smaller values mean less drift, so it's intuitive and easy to apply for moderate shifts.
❌ Struggles to catch extreme shifts,
The K-S test is a nonparametric method that compares two cumulative distributions to find the largest distance between them.
✅ It's distribution-agnostic, so it's widely applicable.
❌Sensitive to sample size, which can lead to false positives.
Want to implement these in Python?
Check out this comprehensive resource: https://lnkd.in/g-9n5cgv
Data Drift Detection in ML Production. How to get started?
When the statistical properties of the production data change over time, the model becomes unreliable and can possibly go obsolete.
Univariate drift detection focuses on detecting changes in the distribution of an individual feature. It involves comparing newer data distributions to older ones to spot deviations or shifts.
There are major 6 methods but lets discuss prominent two here.
The Jensen-Shannon Distance measures the dissimilarity between two probability distributions by assessing their overlap.
One of its strengths is that it’s sensitive to smaller shifts, making it great for identifying subtle changes in data. But, it doesn’t distinguish between very strong and extreme drifts.
On the other hand, Wasserstein Distance captures both shape and location differences between distributions. It’s also a true metric, satisfying properties like symmetry and triangle inequality.
While it excels at highlighting how distributions differ, it can be sensitive to extreme values
Interested in exploring more methods and their Python implementations? Check here: https://lnkd.in/d9h_hh6k
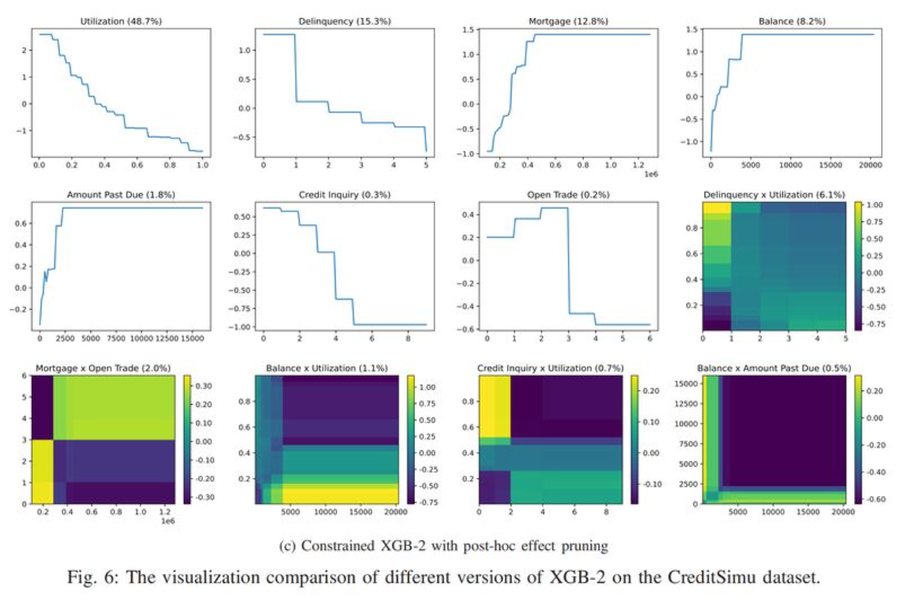
A new paper proposes a method to create fully explainable tree ensembles without using post-hoc methods like SHAP
A high-performance ensemble of a large number of decision trees lacks sufficient transparency and explainability.
By using shallow decision trees as base learners, it’s possible to transform a complex tree ensemble into an ANOVA-based structure that functions as a generalized additive model (GAM).
This paper proposes a 3 step algorithm to make them less of a “black box”:
[1] Each tree in the ensemble is broken down to reveal the individual effects of features and their interactions. At each leaf node, the path of split variables determines whether it indicates a main effect or an interaction. For a depth-d tree ensemble, each leaf node can have up to d distinct split variables, allowing us to capture higher-order interactions. This is called aggregation.
[2] Functional ANOVA can face identifiability issues without constraints. A main effect term might be absorbed into its parent interactions. That means multiple equivalent representations and non-unique interpretation. The purification step “un-tangles” this by calculating mean values along each dimension and adjusting values recursively until convergence.
[3] In the final step, attribution, we score each feature and feature interaction on the model’s output, both at the local and global levels. Local attribution breaks down the model output for a single prediction into contributions from each feature and global works across the entire dataset.
You get a clear view of which features (or combinations) are the biggest influencers in the model’s predictions.
Here is the link to the paper : https://lnkd.in/d4CsMDS2
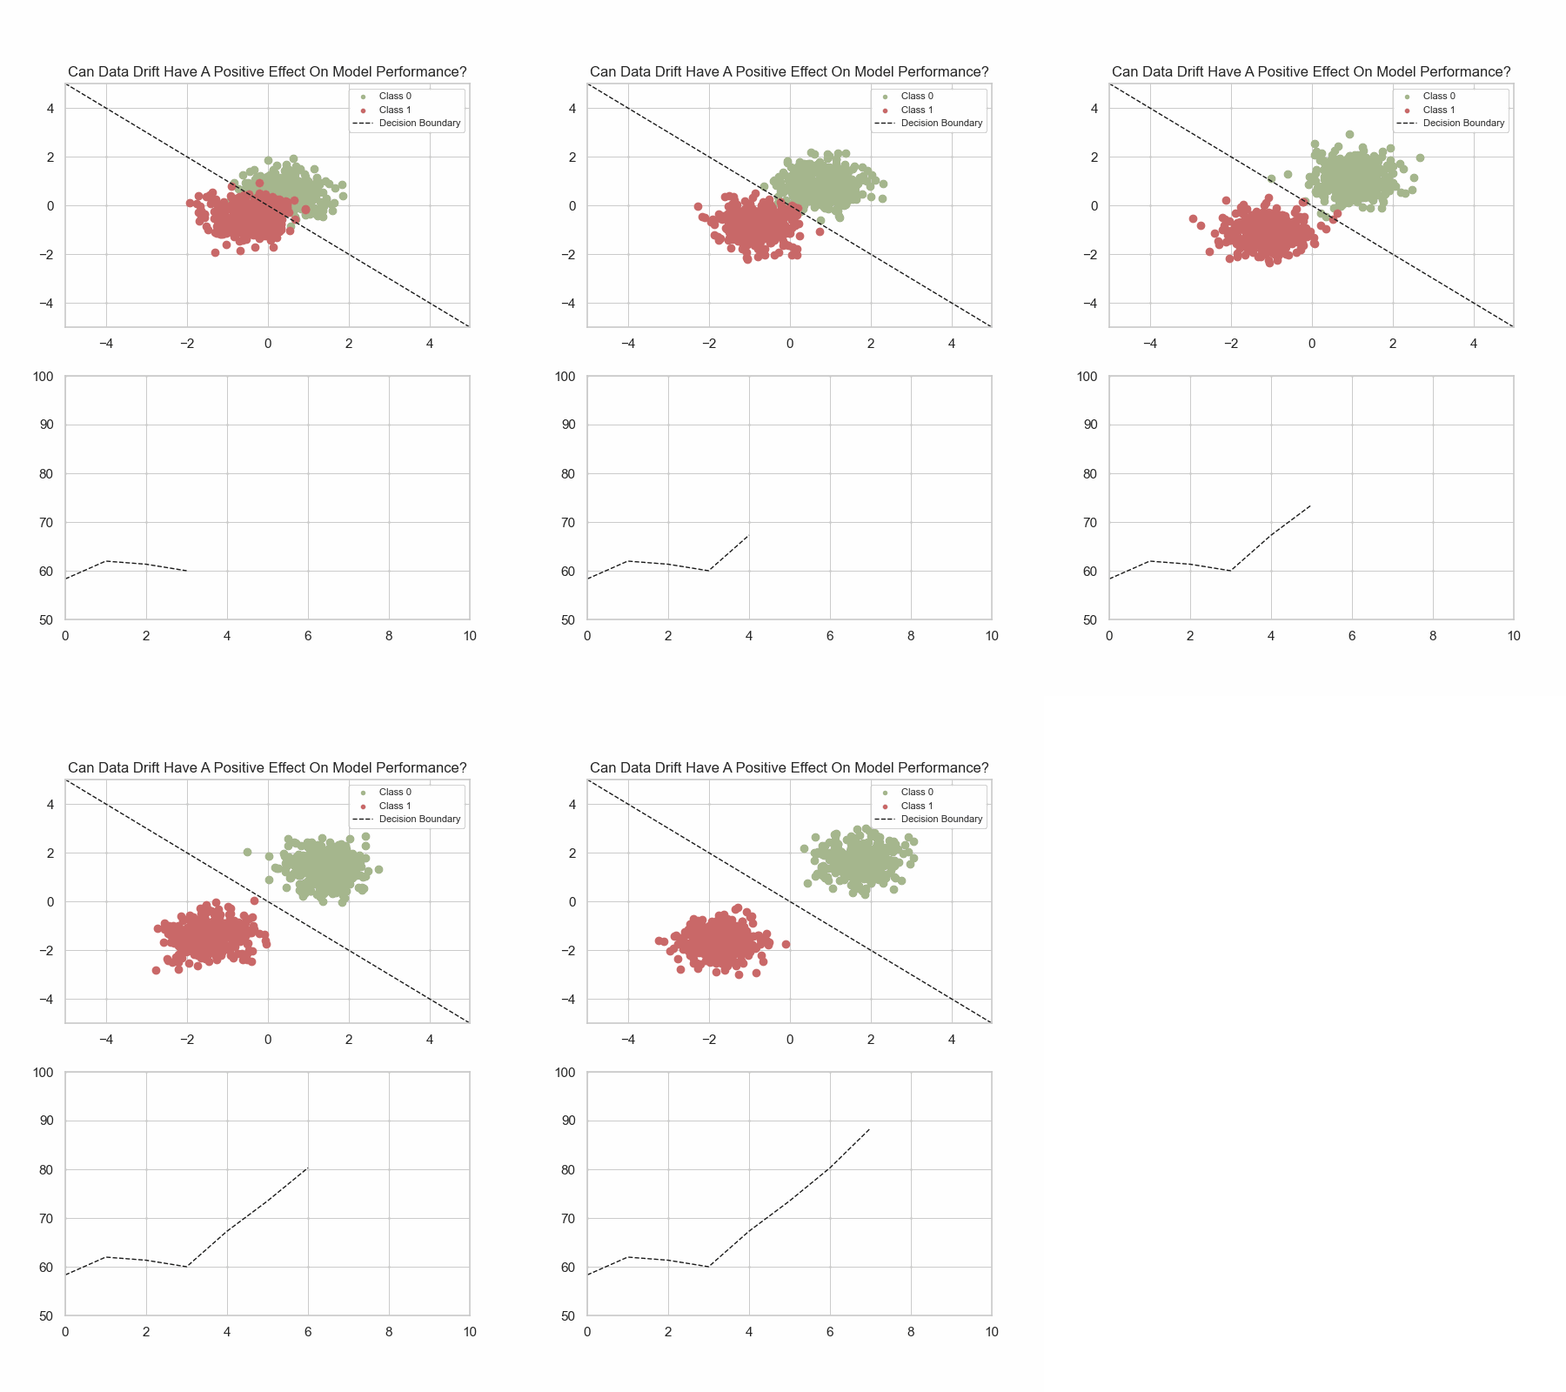
No, data drift does not mean your ml model is degrading in performance
Most people and tools assume that they need to retrain their models the moment they see a drift.
The truth is that data drift simply shows that your model is encountering new patterns in the input data over time. Sometimes, this drift can actually signal that the model is adapting better to new data.
See that the two classes were somewhat overlapping and difficult for the model to separate. With time the data drifts, the classes begin to shift in a way that makes them clearer and more distinguishable.
The concepts the model initially learned during training are now easier to realize.
In these situations, the model’s learning becomes more evident and accuracy gradually improves.
If there’s one thing I want you to take away from this post, it’s this: never monitor data drift alone. We care about model performance, so that’s what we should be tracking.
And with methods to estimate performance metrics, the old excuse of “we don’t have ground truth yet” is no longer valid.
If this is new for you and you want to read more about this, check this out: https://lnkd.in/dvAPGiEz
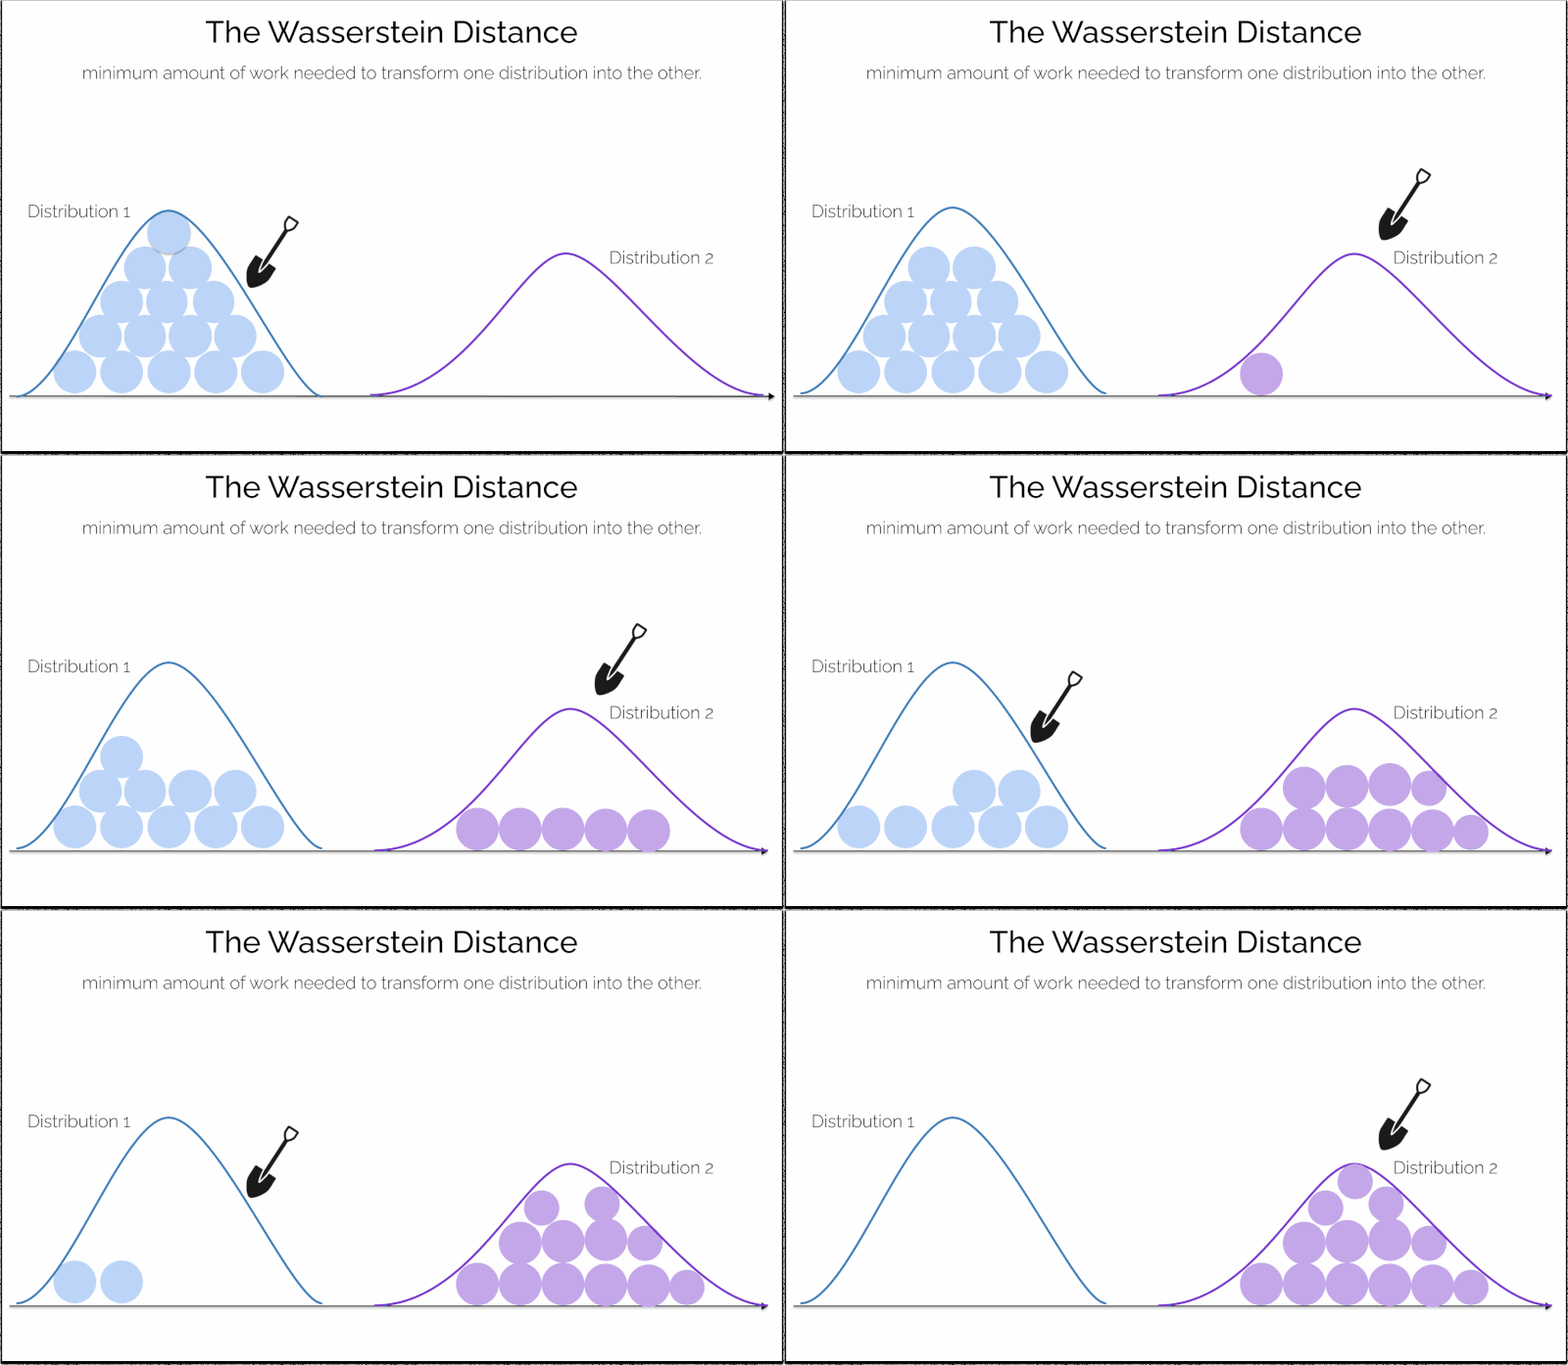
What is the Earth Mover’s Distance and why should it matter to data scientists?
Each probability distribution is like a pile of dirt, and the Wasserstein Distance is the minimum amount of “work” needed to transform one pile into the other.
It captures both shape and distance between the distributions and this is why it becomes particularly valuable when dealing with high-dimensional data like images.
NannyML uses this distance as one of the methods to detect univariate drift.
For one-dimensional distributions, we can make things easier by using cumulative distribution functions (CDFs).
This way, the Wasserstein Distance is simply the area between the two CDFs.
Have you used this metric as a univariate drift method?
One of the best papers I’ve read is A Gentle Introduction to Conformal Prediction and Distribution-Free Uncertainty Quantification.
It covers conformal prediction types from scratch and goes up to advanced ideas like conformal Bayes with great visuals provided at every step for new concepts.
Plus, it’s written in a “science-casual” style, where all formulas are both described and explained clearly.
If you want to build an intuitive understanding of conformal prediction, this is the perfect place to start.
Link to the paper in the comments
I've always wanted a book that brings together all the important ML metrics in one place.
So I am writing one with Santiago Viquez
In the Little Book of ML Metrics, we’ll cover metrics for Regression, Classification, Clustering, Ranking, Vision, Text, GenAI, and Bias & Fairness.
Pre-order your copy today at a discount here: https://lnkd.in/dKwW52yY
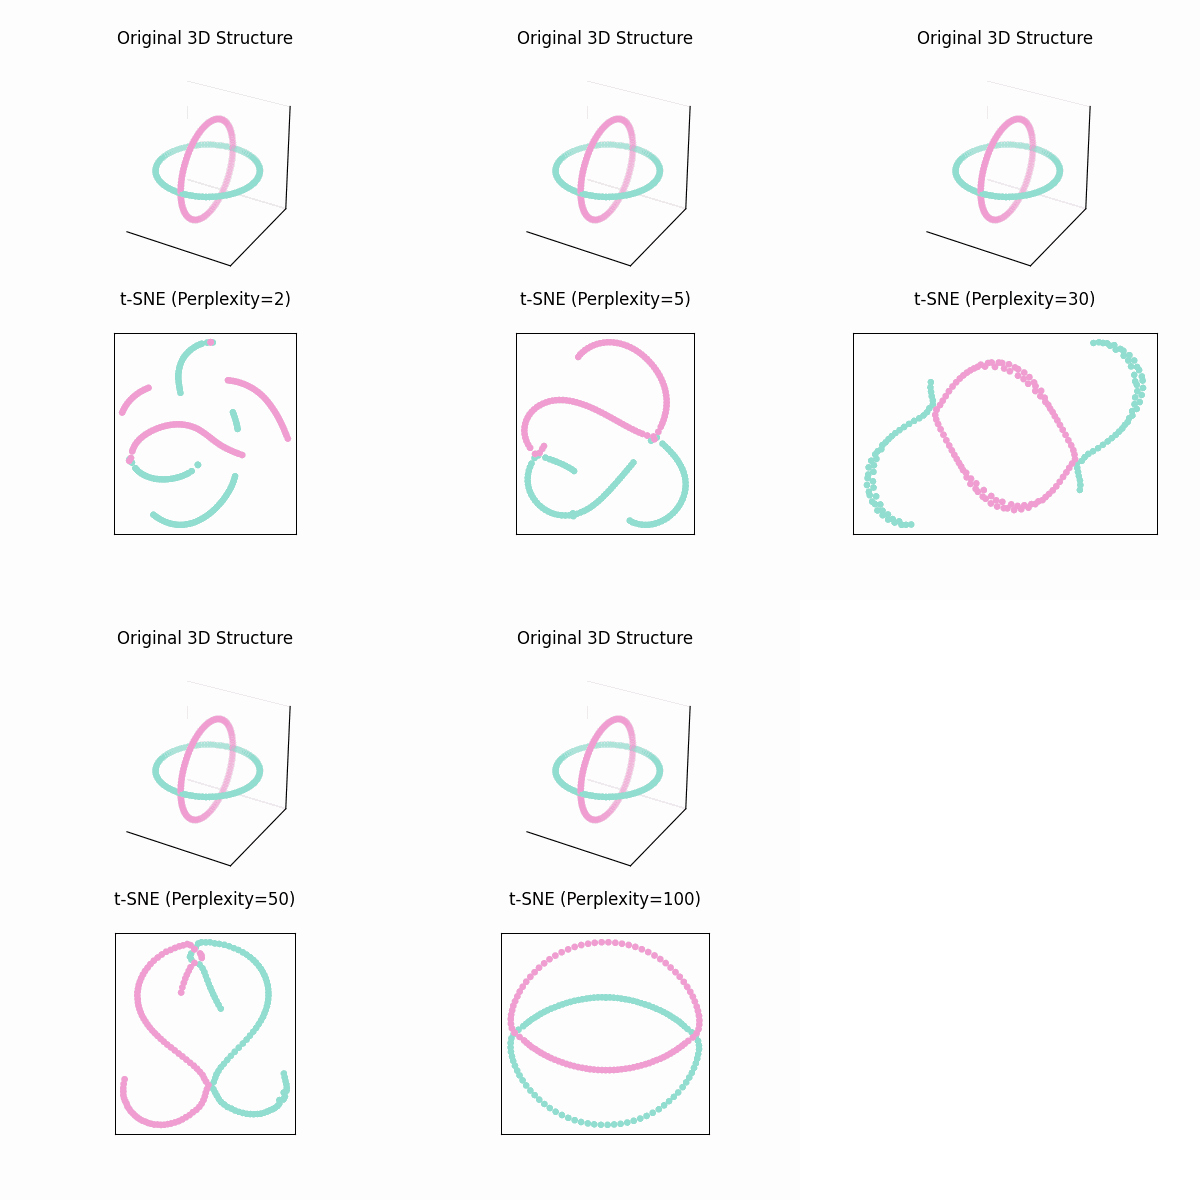
The t-SNE technique really is useful but only if you know how to interpret it.
It has an almost magical ability to create compelling two-dimensonal “maps” from data with hundreds or even thousands of dimensions.
Out of sight from the user, the algorithm makes all sorts of adjustments that tidy up its visualizations.
Perplexity is a tuneable parameter that shows how to balance attention between local and global aspects of your data.
“The parameter is, in a sense, a guess about the number of close neighbors each point has. The perplexity value has a complex effect on the resulting pictures. “
The trefoil knot is an interesting example of how multiple runs affect the outcome of t-SNE.
Below are five runs of the perplexity = [2, 5, 30, 50, 100] and only once it shows the connected-ness , rest of the runs it ends up introducing artificial breaks.
Only looking at multiple perplexity values gives the most complete picture.
Data scientists are spending more time maintaining their models, and concept drift is one of the main culprits.
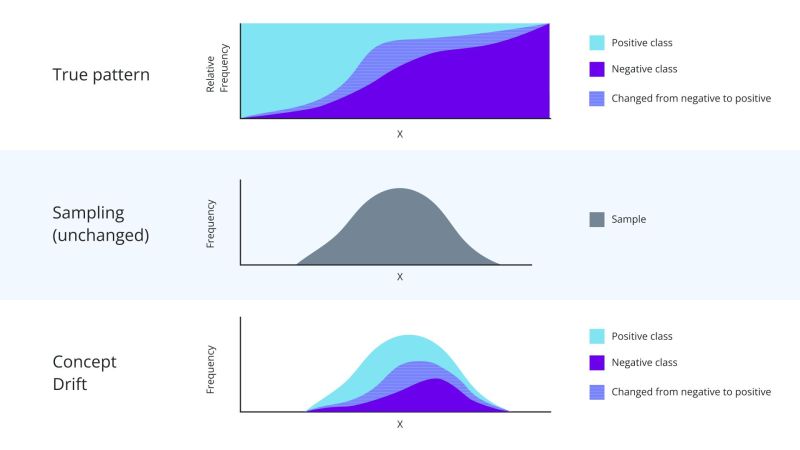
When the relationship between inputs and outputs shifts over time, even though the inputs stay the same, we see concept drift in action. This makes model monitoring more challenging.
The Reverse Concept Drift Algorithm quantifies this problem.
By training a new model on the updated concept and comparing it to the existing one, it gives us a clear view of how the current model would perform under changing conditions.
Have you faced issues with concept drift in your models? How do you handle it?
I have linked a resource to help you learn about the algorithm more👇
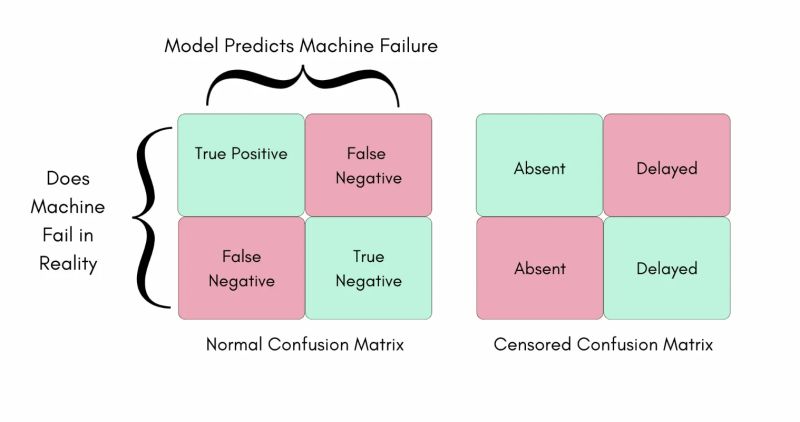
We are taught about confusion matrices in textbooks, but in production scenarios, this confusion matrix gets censored.
What does that mean?
In ML, we need ground truth or true labels to calculate performance metrics.
But in the real world, ground truth is often delayed or absent in most scenarios.
Predictive maintenance models tell us the possibility of a machine failing and when it needs repairs.
If the model predicts a machine breakdown and maintenance is scheduled, the machine might never fail in real life.
This raises the question: How can we be sure the model was correct? Is there a way to know whether our machine would have failed if we hadn’t maintained it?
This lack of failure is our intended outcome, But it also means there’s no immediate failure data and as a result, the confusion matrix is “censored.”
If we have no TP, TN, FN, or FP, how do we calculate performance metrics?
And what do we tell stakeholders when we have no performance data?
This is a serious issue that data scientists often realize too late.
Do you know the solution? Tell me in the comments below.
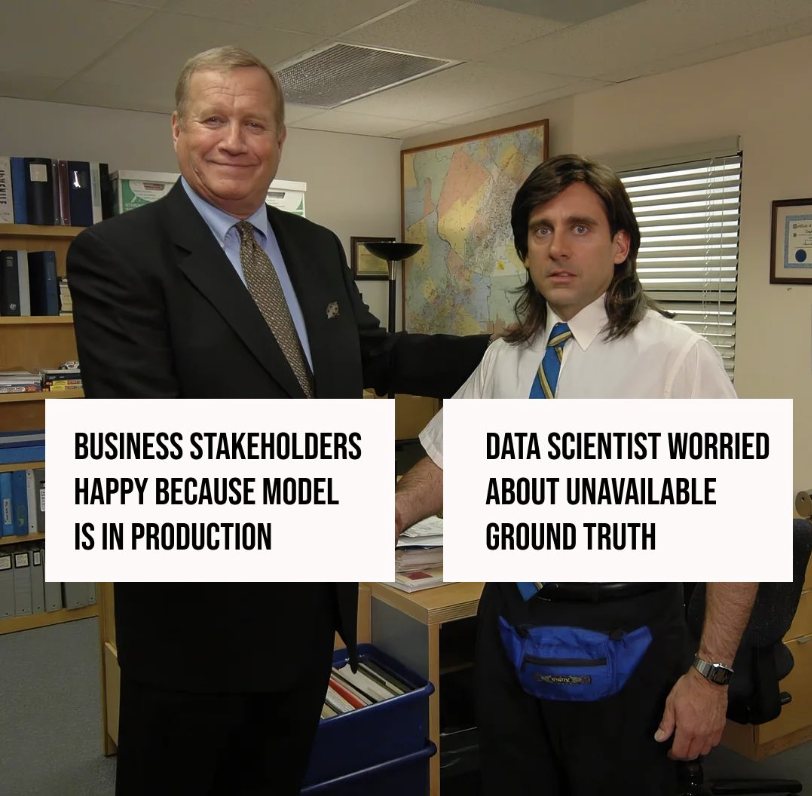
Ground truth can keep data scientists up at night. Why?
Because it’s essential for calculating the performance of an AI model—but it’s not always available.
Here are three scenarios to consider:
1. Instant Ground Truth
With predictions like delivery time, ground truth is immediate. You can monitor performance in real-time and catch any issues as soon as they appear.
2. Delayed Ground Truth
In demand forecasting, ground truth might lag by months. By the time you measure performance, the business impact may already be felt.
3. Absent Ground Truth
In predictive maintenance, ground truth may never be available. If maintenance prevents a failure, we’ll never know if the machine would’ve failed without intervention.
When calculating performance isn’t an option, we can still estimate it.
Algorithms like CBPE, PAPE, and DLE offer ways to assess performance without direct ground truth.
Learn more about the algorithms here: https://lnkd.in/eejGMFWv
Most of a machine learning model’s life happens after deployment, yet 91% of models degrade.
One of the primary reasons for this is the covariate shift.
Covariate shift is defined as a change in the distributions of a model's input features P(X), while P(Y∣X) remains unchanged.
Covariate shift detection can further be broken down into univariate and multivariate drift. The former deals with shifts in a single feature, while the latter refers to shifts in the joint distributions of some or all features.
So, why not just retrain our models periodically?
Retraining might only partially solve the issue or might not solve it at all. This is because a shift in the input data distribution doesn’t necessarily mean that the relationship between X and Y that the model is trying to learn has changed.
In supervised learning, the model tries to learn (Y∣X). Retraining might not remedy your degraded model if this relationship has not changed.
Instead, adjusting prediction thresholds might be the best solution for ensuring your model in production can still make key predictions and deliver value.
What post-deployment challenges have you encountered with your models?
When you deploy an ML model, it becomes part of a dynamic system.
Your model doesn’t just passively predict; it can influence the data it’s trained on, often leading to unexpected outcomes over time.
Consider this:
You launch a churn prediction model that works wonders initially. Churn rates drop, and, confident in its success, you set up automated retraining.
But a few months later, churn spikes. What happened?
The model’s success caused retention teams to retain more potential churners, who are then labeled as "non-churners" in retraining data. The model starts predicting that high-risk customers will stay while true churners slip through unnoticed.
Here’s how to guard against this common feedback loop and prevent such failure:
1. Define your prediction goal carefully:
Aim to predict who is likely to churn and can be retained, not just any churners.
2. Track model interactions with reality:
Realize that by targeting likely churners who can be retained, you’re shifting those outcomes in the data.
3. Monitor data drift:
Understand that retention efforts might impact the model’s ability to recognize potential churners.
4. Dampen feedback loops:
Hold back a control group, not targeted for retention, to ensure retraining data captures the full churn-risk spectrum.
5. Leverage dynamical behavior:
Consider blending predictions from the original and retrained models to spot high-risk churners who may respond to interventions.
Managing ML models is as much about anticipating dynamics as it is about technical tuning.
Preventing negative feedback loops preserves your model’s impact and keeps performance strong in the real world.
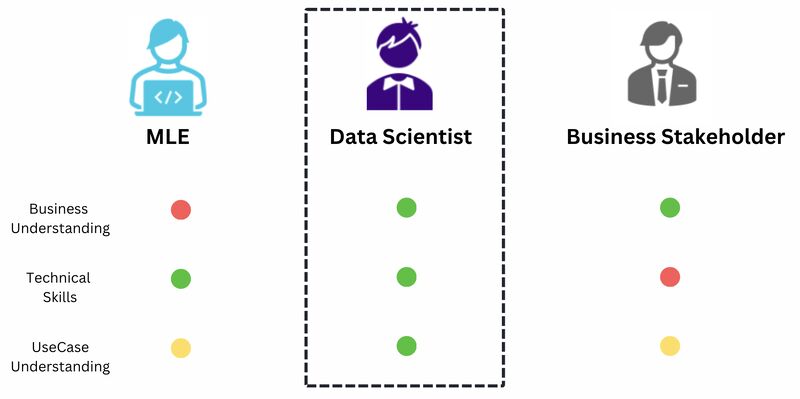
Who can truly fix post-deployment issues with ML models?
Machine Learning Engineers know the tech but often lack business context.
Business stakeholders understand goals but don’t have the technical depth to solve model failures.
When your model drifts, or the predictions start to miss the mark, they cannot bridge the gap.
Data scientists can.
They understand the model's purpose, can troubleshoot effectively, and adapt to business shifts. Without that mix, your model may continue to stumble.
Why Monitoring ML Models in Production is Challenging
As senior data scientists, we're all familiar with the complexities of deploying machine learning models. But the real challenge lies in what comes after deployment—monitoring these models in production.
It's not just about the code or the data; it's about ensuring that the model itself continues to perform as expected, even as the environment around it changes.
Delayed ground truth is one of the biggest challenges. Unlike instant feedback loops where you can validate predictions immediately, many real-world scenarios force us to wait for the actual outcomes, leaving our models vulnerable to silent degradation.
This delay creates a monitoring blind spot, making it difficult to detect when a model’s performance starts to degrade.
There are algorithms available that can help in case ground truth is unavailable, like Confidence-Based Performance Estimation for classification models.
For regression we can use Direct Loss Estimation. Once a performance drop is detected the next step is to understand why and how we can fix issues.
For those of us responsible for models that drive critical business decisions, this is a reminder that data science doesn’t stop at deployment.
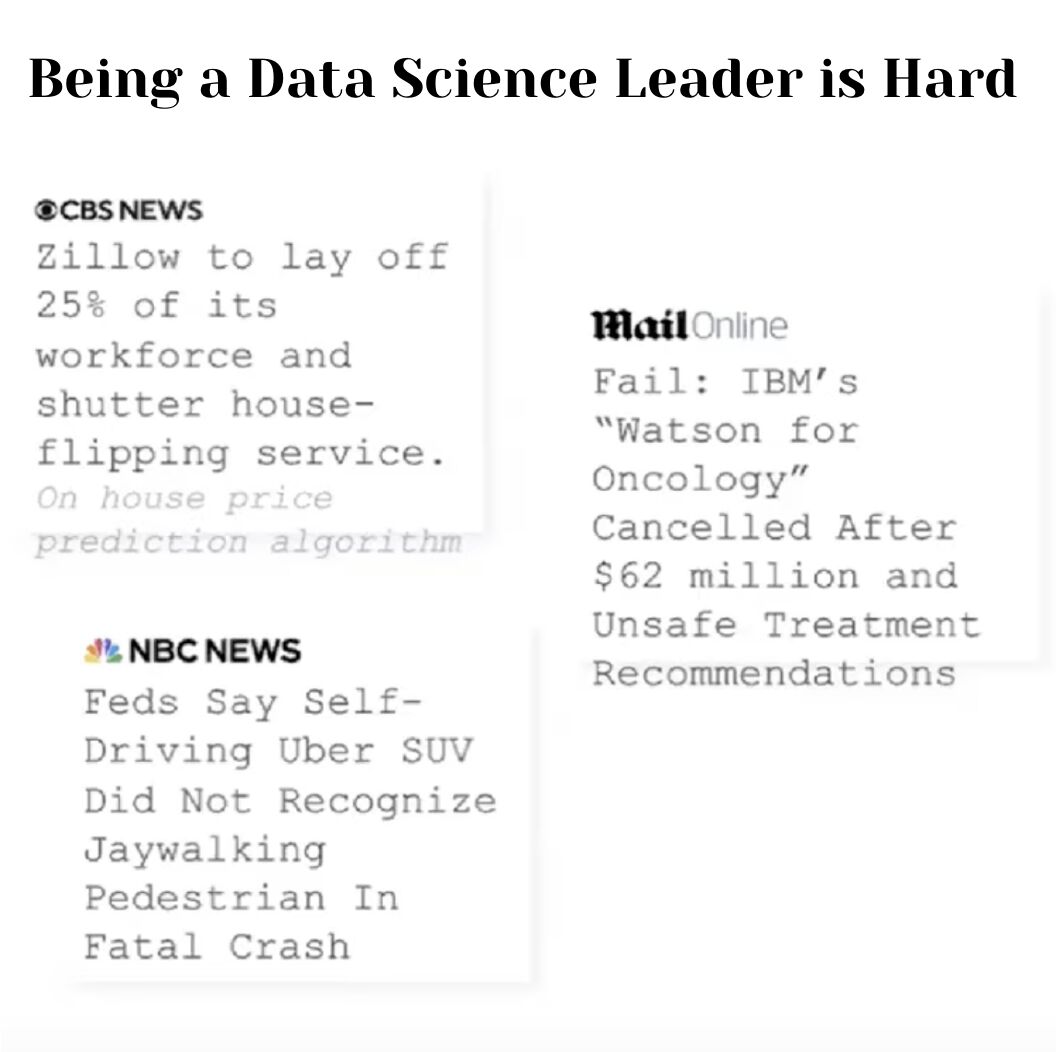
Why Being a Data Science Leader is Tougher Than Ever
Leading data science teams goes beyond building models; it’s about managing the risks that come with deploying them in real-world scenarios.
AI model failures can have real consequences:
• Zillow had to lay off 25% of its workforce after issues with its house price prediction algorithm.
• IBM’s Watson for Oncology faced shutdowns after inaccurate recommendations cost millions.
• Uber’s self-driving tech encountered tragic incidents due to missed detections.
When AI fails, it’s not just about the model, it impacts trust, burdens teams with extra work, and can lead to substantial financial losses.
As a data science leader, catching these issues early is critical.
Monitoring models can no longer be reactive, you need to get proactive and stop issues before they hit business.
Concept drift occurs when P(Y∣X) changes while P(X) remains unchanged.
In simple terms, the ml model’s learned patterns become outdated.
To address this issue, we developed the Reverse Concept Drift (RCD) algorithm.
This algorithm compares a model's performance on reference data(the original dataset) with its performance on current data.
If drift is detected, it indicates that a new concept exists in the production data that was not present previously.
But how did we arrive at this innovative algorithm?
In the latest post-deployment data science blog, Kavita discusses the experiments that led to the development of RCD.
Read here: https://lnkd.in/ehkwiTVD
How do we use Principal Component Analysis in post-deployment data science?
PCA is a technique that determines the best features while lowering the dimensionality of data.
It achieves this by finding the axes (principal components) that best represent the spread of the data points in the original feature space. These axes are orthogonal to each other and capture the directions of maximum variance in the data. PCA creates a new feature space that retains the most valuable information by projecting the data onto these axes.
This notion of PCA is used to detect data drift.
As the underlying structure evolves, the dataset will drift, and the older main components may no longer be effective at catching new trends.
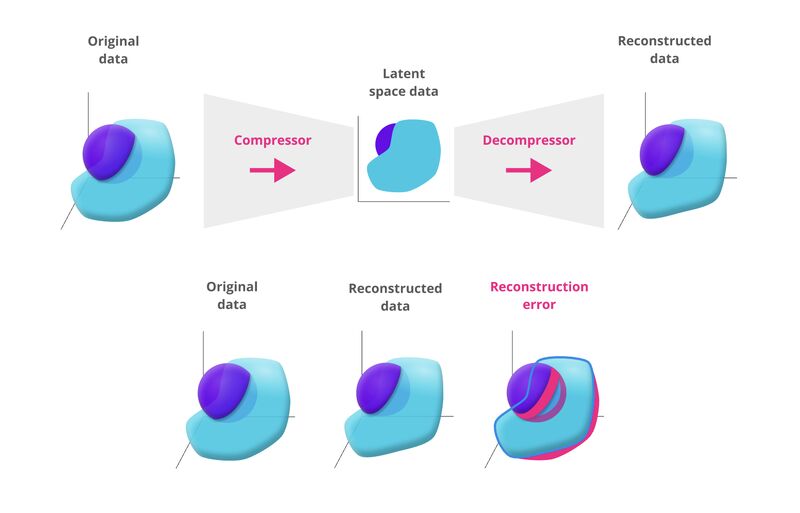
NannyML’s Reconstruction with PCA algorithm detects this by comparing the original dataset to a compressed version based on the principal axes.
If the compressed version has major difference from the original, it indicates that the relationships between the variables have changed which means drift is present.
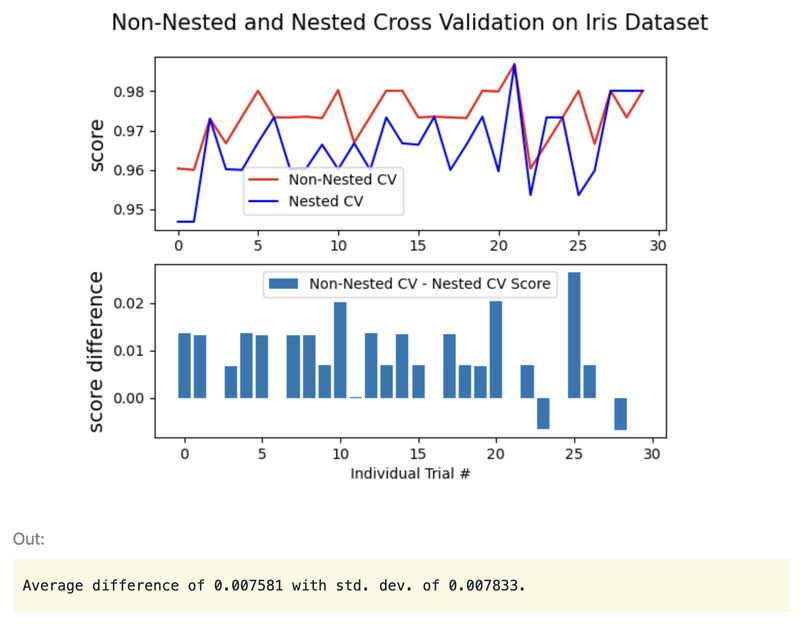
You could be overfitting not just your model’s parameters but also its hyperparameters?
If you run an extensive hyperparameter search, your algorithm might end up choosing hyperparameters that fit your validation set perfectly but don’t generalize to new data.
Sound familiar?
This issue gets worse when you’re working with a small dataset. That’s why it’s so important to use a separate test set in addition to your cross-validation or validation loop.
Want to estimate generalization performance more reliably? Try nested cross-validation.
Here’s how it works:
1. The inner loop selects your hyperparameters.
2. The outer loop checks how well those hyperparameters generalize.
It might seem a bit complicated, but you don’t have to build it from scratch. Scikit-learn has your back.
I have linked their documentation in the comments for you.
91% of ML models degrade post-deployment. How many of those failures could have been avoided?
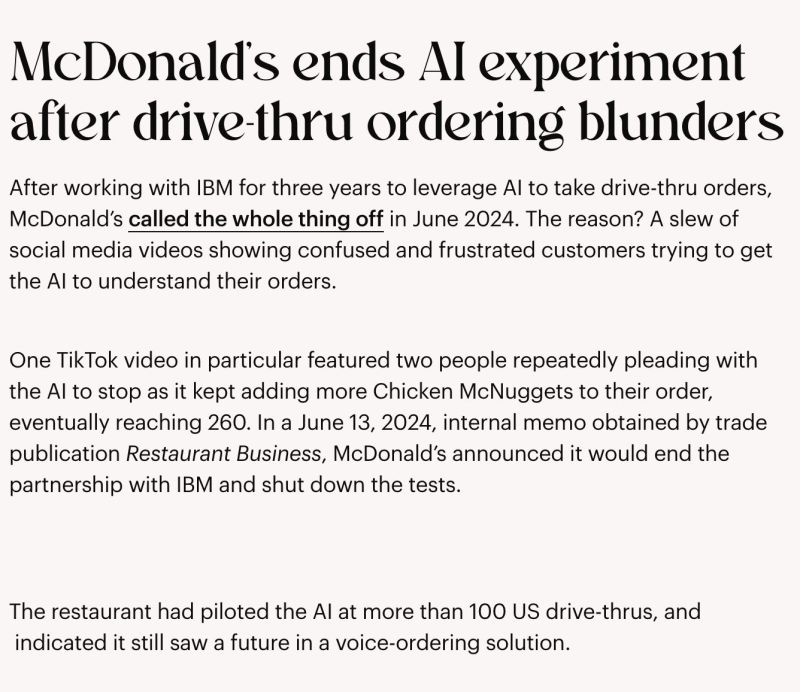
Take McDonald’s AI-powered drive-thru experiment. What began as a promise of efficiency ended in misorders so absurd, one customer adding 260 Chicken McNuggets to their order. 😲
The episode caused customers to lose trust, and the project was ultimately scrapped.
Why does this happen?
Model failures can stem from many causes— data drift, data quality issues, or even operational misalignments. In ML projects these issues arent just technical, they hurt the brand. Monitoring is no longer optional.
Algorithms like PAPE and CBPE help data science teams understand model performance even when ground truth is not available.
Model degradation is real. But it does not have to drag your business down.
Time series models depend on the idea that historical trends, seasonality, and relationships between variables will continue as they have before.
Yet, the world around us is full of surprises.
Economic shifts, market changes, and evolving consumer behaviours can all disrupt these patterns, making the future less predictable than we might hope.
When this happens, the model may start to drift.
A machine learning model experiences data drift when the relationship between its input variables and the target variable changes, even if only slightly.
Over time, these small inaccuracies can accumulate, resulting in forecasts that are no longer reliable.
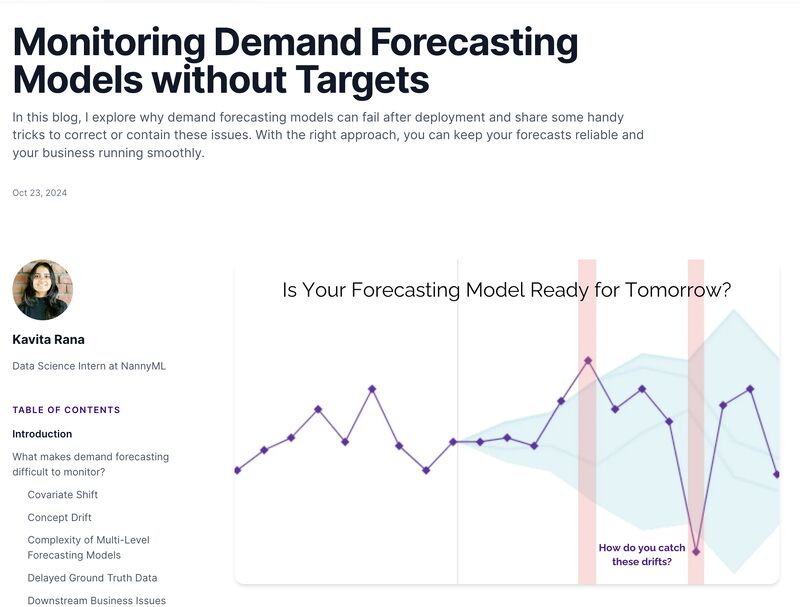
In the latest post-deployment data science blog, Kavita explores how demand forecasting models can fail after deployment and shares some handy tricks to correct or contain these issues.
With the right approach, you can keep your forecasts reliable and your business running smoothly.
How do you manage covariate shifts in your machine-learning models?
A covariate shift occurs when the distribution of your model’s features changes, while the relationship between inputs and outputs stays the same.
In loan default prediction, introducing a low-interest loan might attract a different borrower segment, altering the data distribution. Or, a shift in data collection—like reporting installments in local currency instead of US dollars—can lead to a covariate shift.
How to Address It:
Monitoring can help explain why your model is failing and allow you to perform the necessary feature engineering to get your model back on track.
Want to know more? Check out Miles’s detailed blog about such models here: https://lnkd.in/ea6uaTqM
As data scientists, we know the gravity of correct predictions in critical systems.
Wind turbine energy generation (WTEG) models significantly contribute to grid stability, but they are only as good as the data and monitoring they rely on.
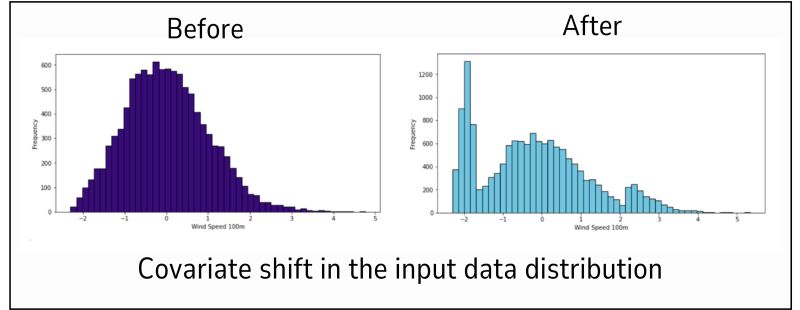
When wind speeds change suddenly or extreme weather alters air density, your model might face a covariate shift. A covariate shift occurs when the distribution of your production data is no longer the same as the training data.
This means your model will produce wrong results, and when your grid relies on these predictions, any failure could result in blackouts or damaged infrastructure.
So, how do we monitor such models?
Taliya has written an extensive blog to answer your worries. She walks you through the NannyML workflow so you can keep your wind energy models breezy.
Read here: https://lnkd.in/emt4hi5g
Data scientists often assess model performance only when ground truth labels are available. 👨💻
But what happens during the gap between predictions and reality?
That blind spot can leave you unaware of critical performance drops or unexpected shifts.
These gaps can cost your team time, resources, and, more importantly, trust in the model.
In machine learning, waiting for ground truth is like driving a car while only watching the rearview mirror.
To stay ahead, you need insights into performance as it happens.
Performance estimation bridges this gap, giving you a real-time estimation of how your models are doing even without labels.
How are you handling the blind spots in your model’s performance?
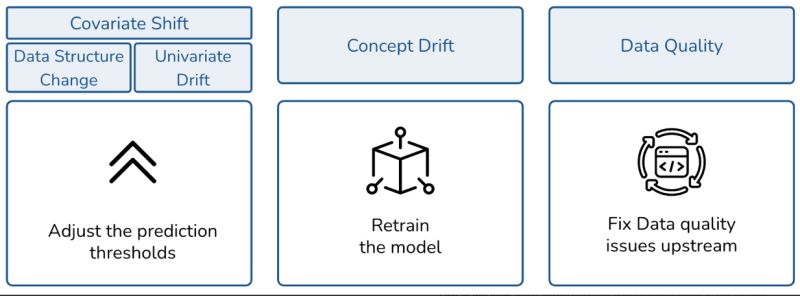
Retraining is not always the right solution when your ML model is degrading in production.
Miles wrote a blog explaining how, depending on the cause of the degradation, a different resolution approach is warranted.
He explores three common reasons why models degrade over time:
1. Covariate shift
2. Concept drift
3. Data quality issues
and explains the recommended course of action for each.
Here is the link for the blog: https://lnkd.in/g7fWwhWy
Enjoy the read and share your thoughts in the comments!
How would a credit card fraud detection model degrade over time?
It could be covariate shift, concept drift, data quality issues or all at once.
Miles has put together a blog discussing how these issues can set in and degrade your model post-deployment. Plus, there's a hands-on tutorial to help you see these concepts in action.
It's not just about building a model; it's about continuously monitoring and adapting it to stay ahead of the fraudsters.
Have you faced any challenges with fraud detection models? I'd love to hear how you've controlled them!
Read here: https://lnkd.in/ercyNFxP
👍❤️💡354 comments
LikeCommentRepostSend
Build a technical audienceGet visitors to your websiteFeed your sales pipeline